Analyzing Crash Causes with Android Studio Debugging on Real Devices
When software crashes on a real device, we often cannot directly obtain the error logs, so we typically need to rely on third-party tools to capture and analyze the logs. This article documents the debugging process of a Unity game frequently crashing in the Android environment, using Android Studio 2025.1.4.8 for log capture.
Mobile Device
Prepare a phone that can reproduce the issue and enter developer mode for debugging. The method to enter developer mode may vary by phone brand (generally similar steps, just different menu and option names), so you can look it up online. This article demonstrates using my Xiaomi 15.
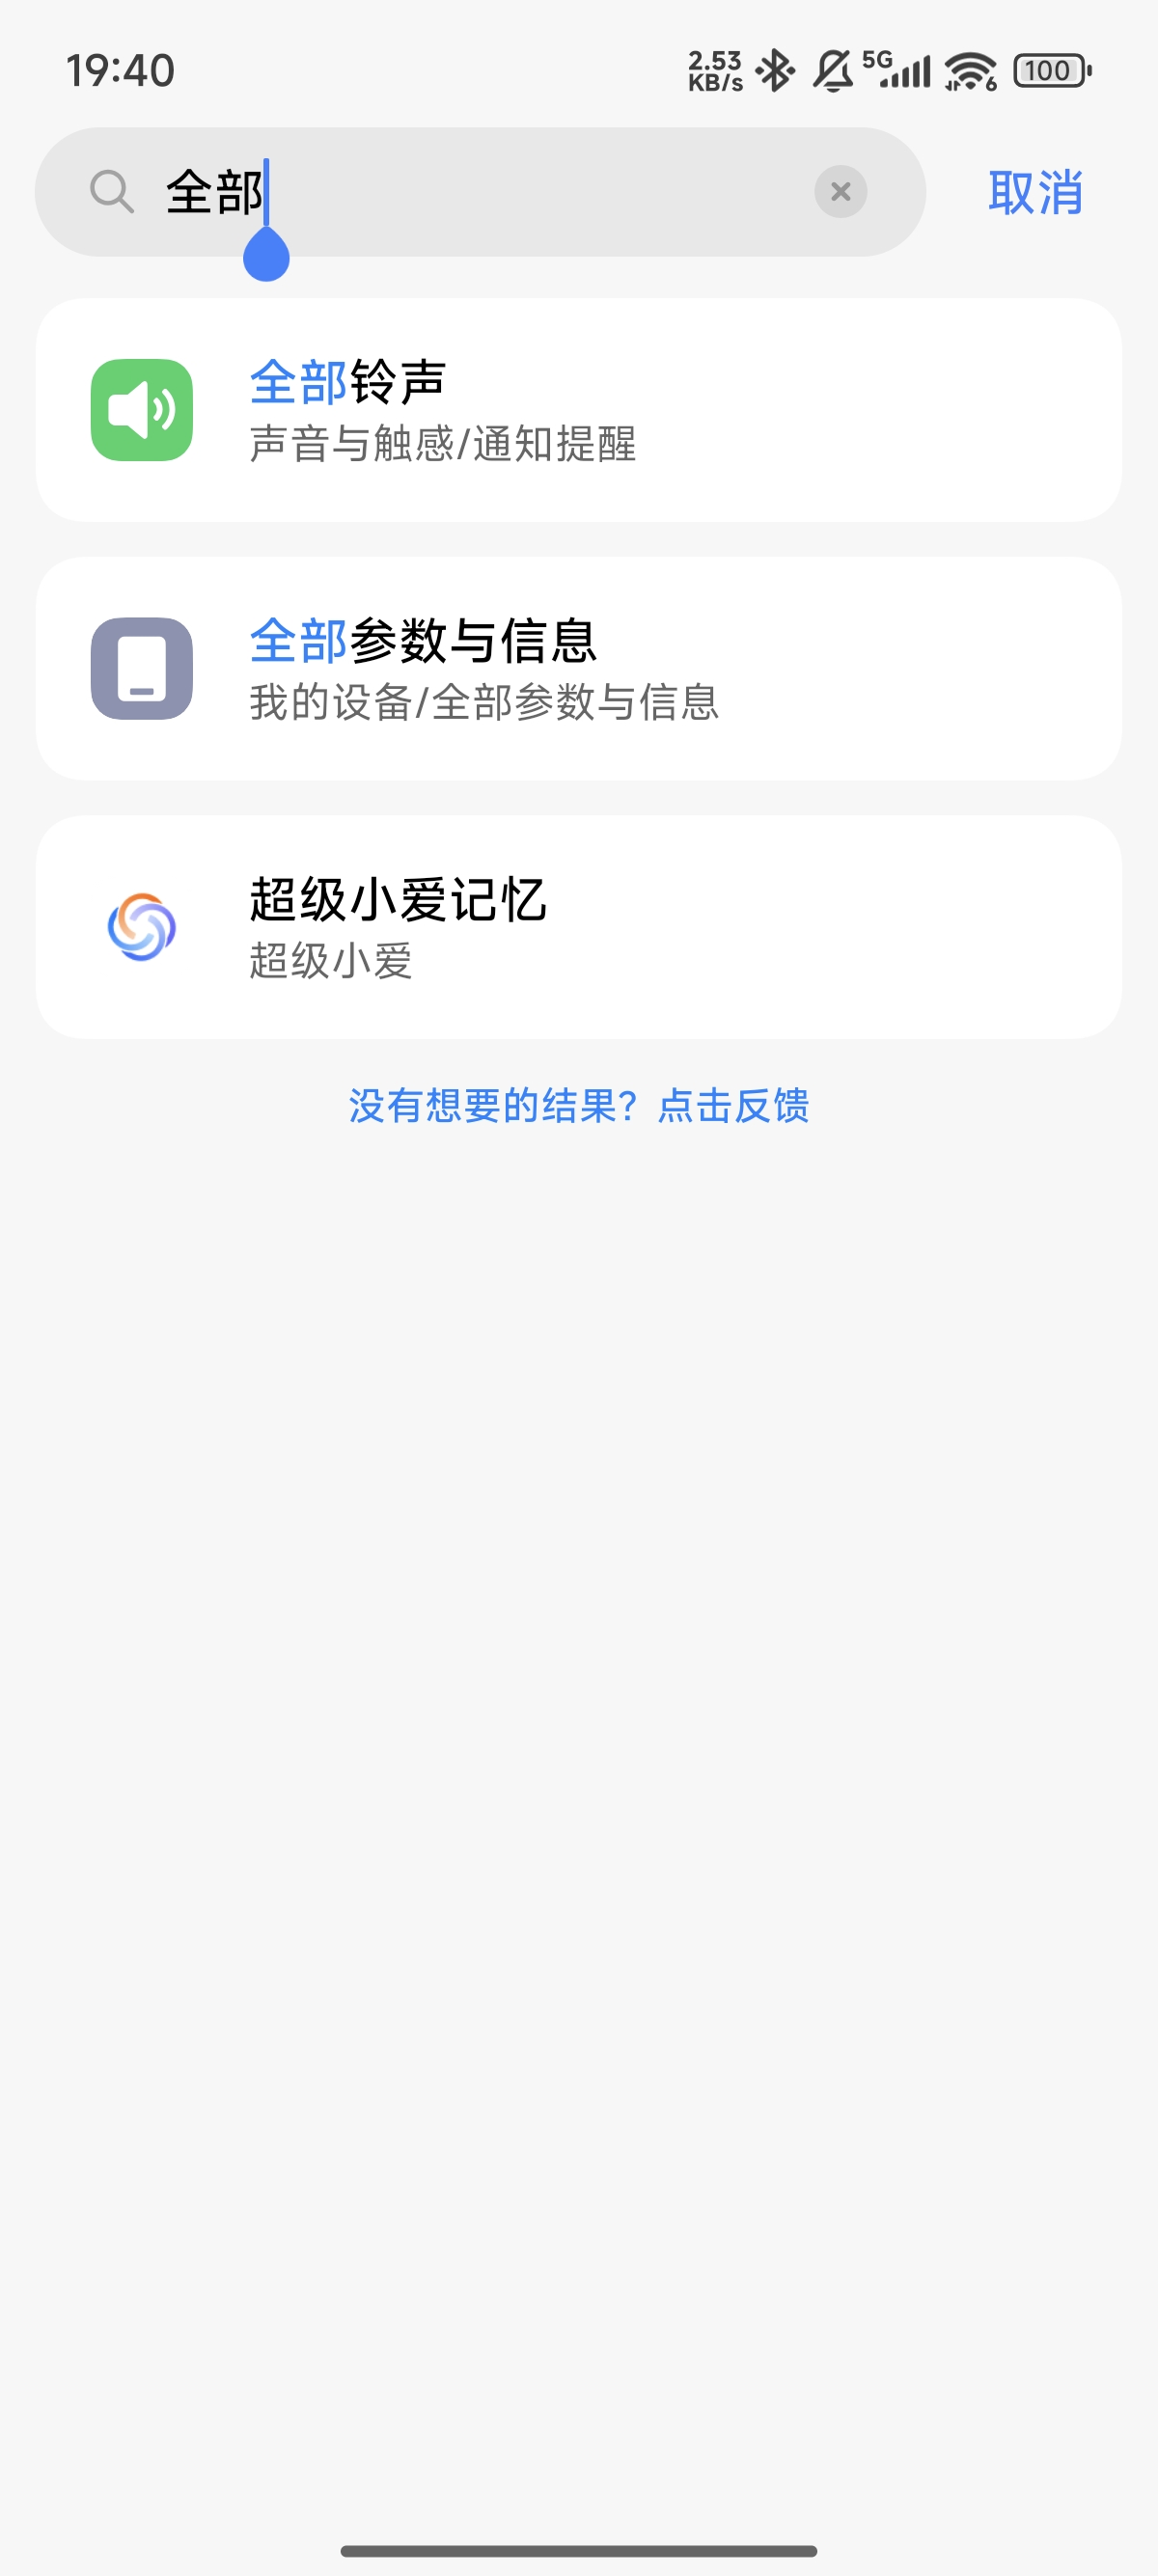
Open the settings and search for “All parameters and information” in the search bar (or navigate from “About phone” or similar interfaces, as you wish), and go to the details page:
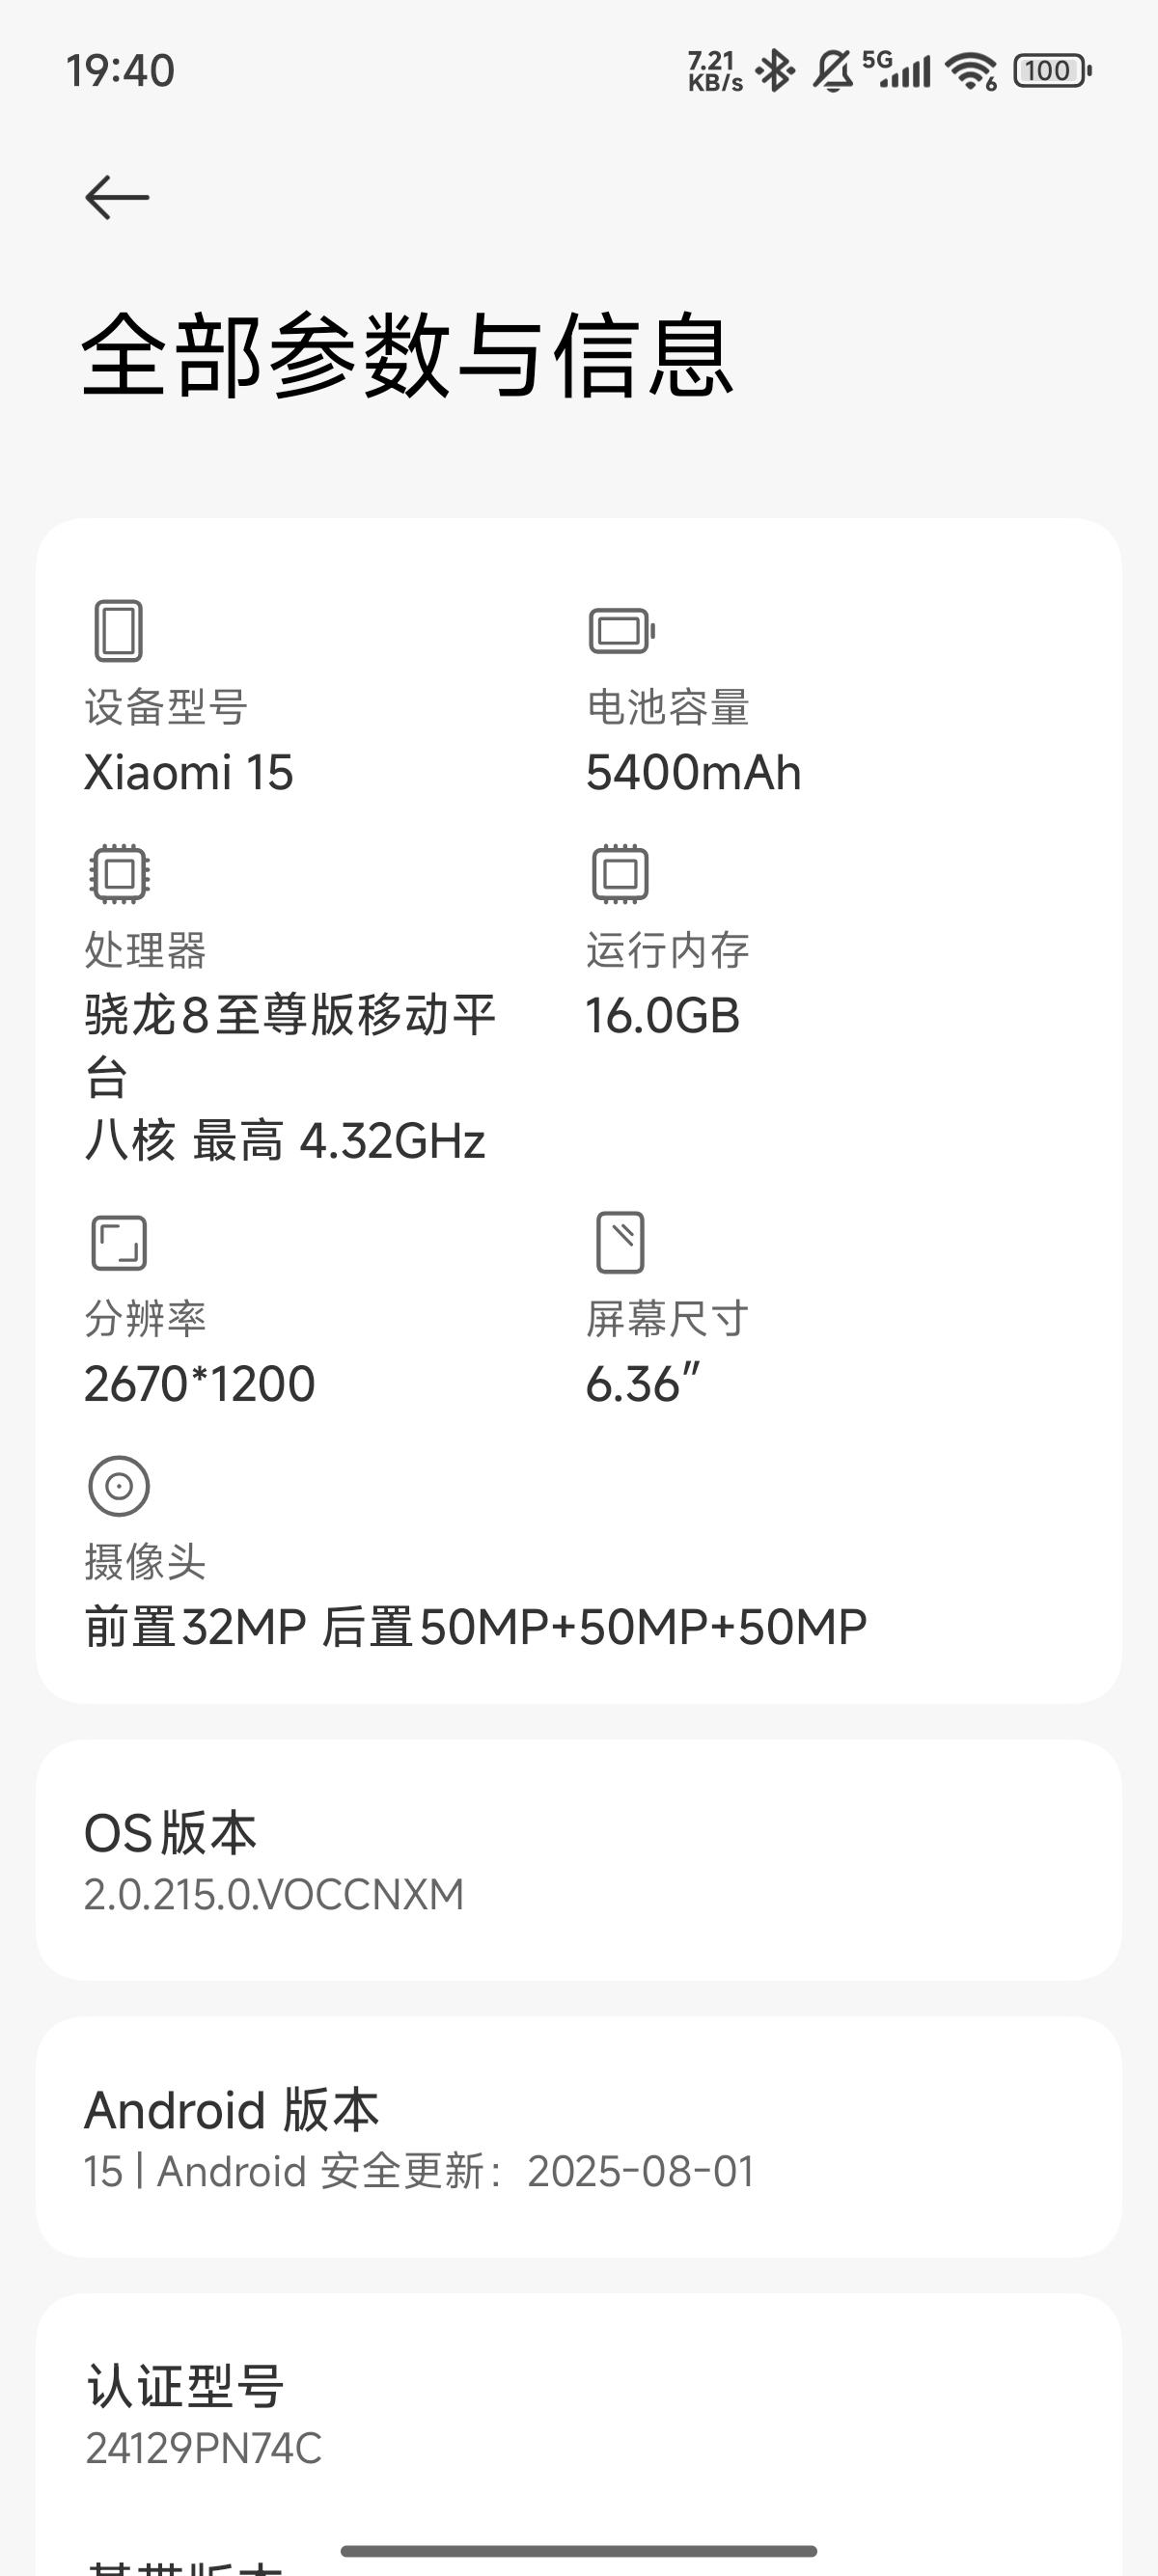
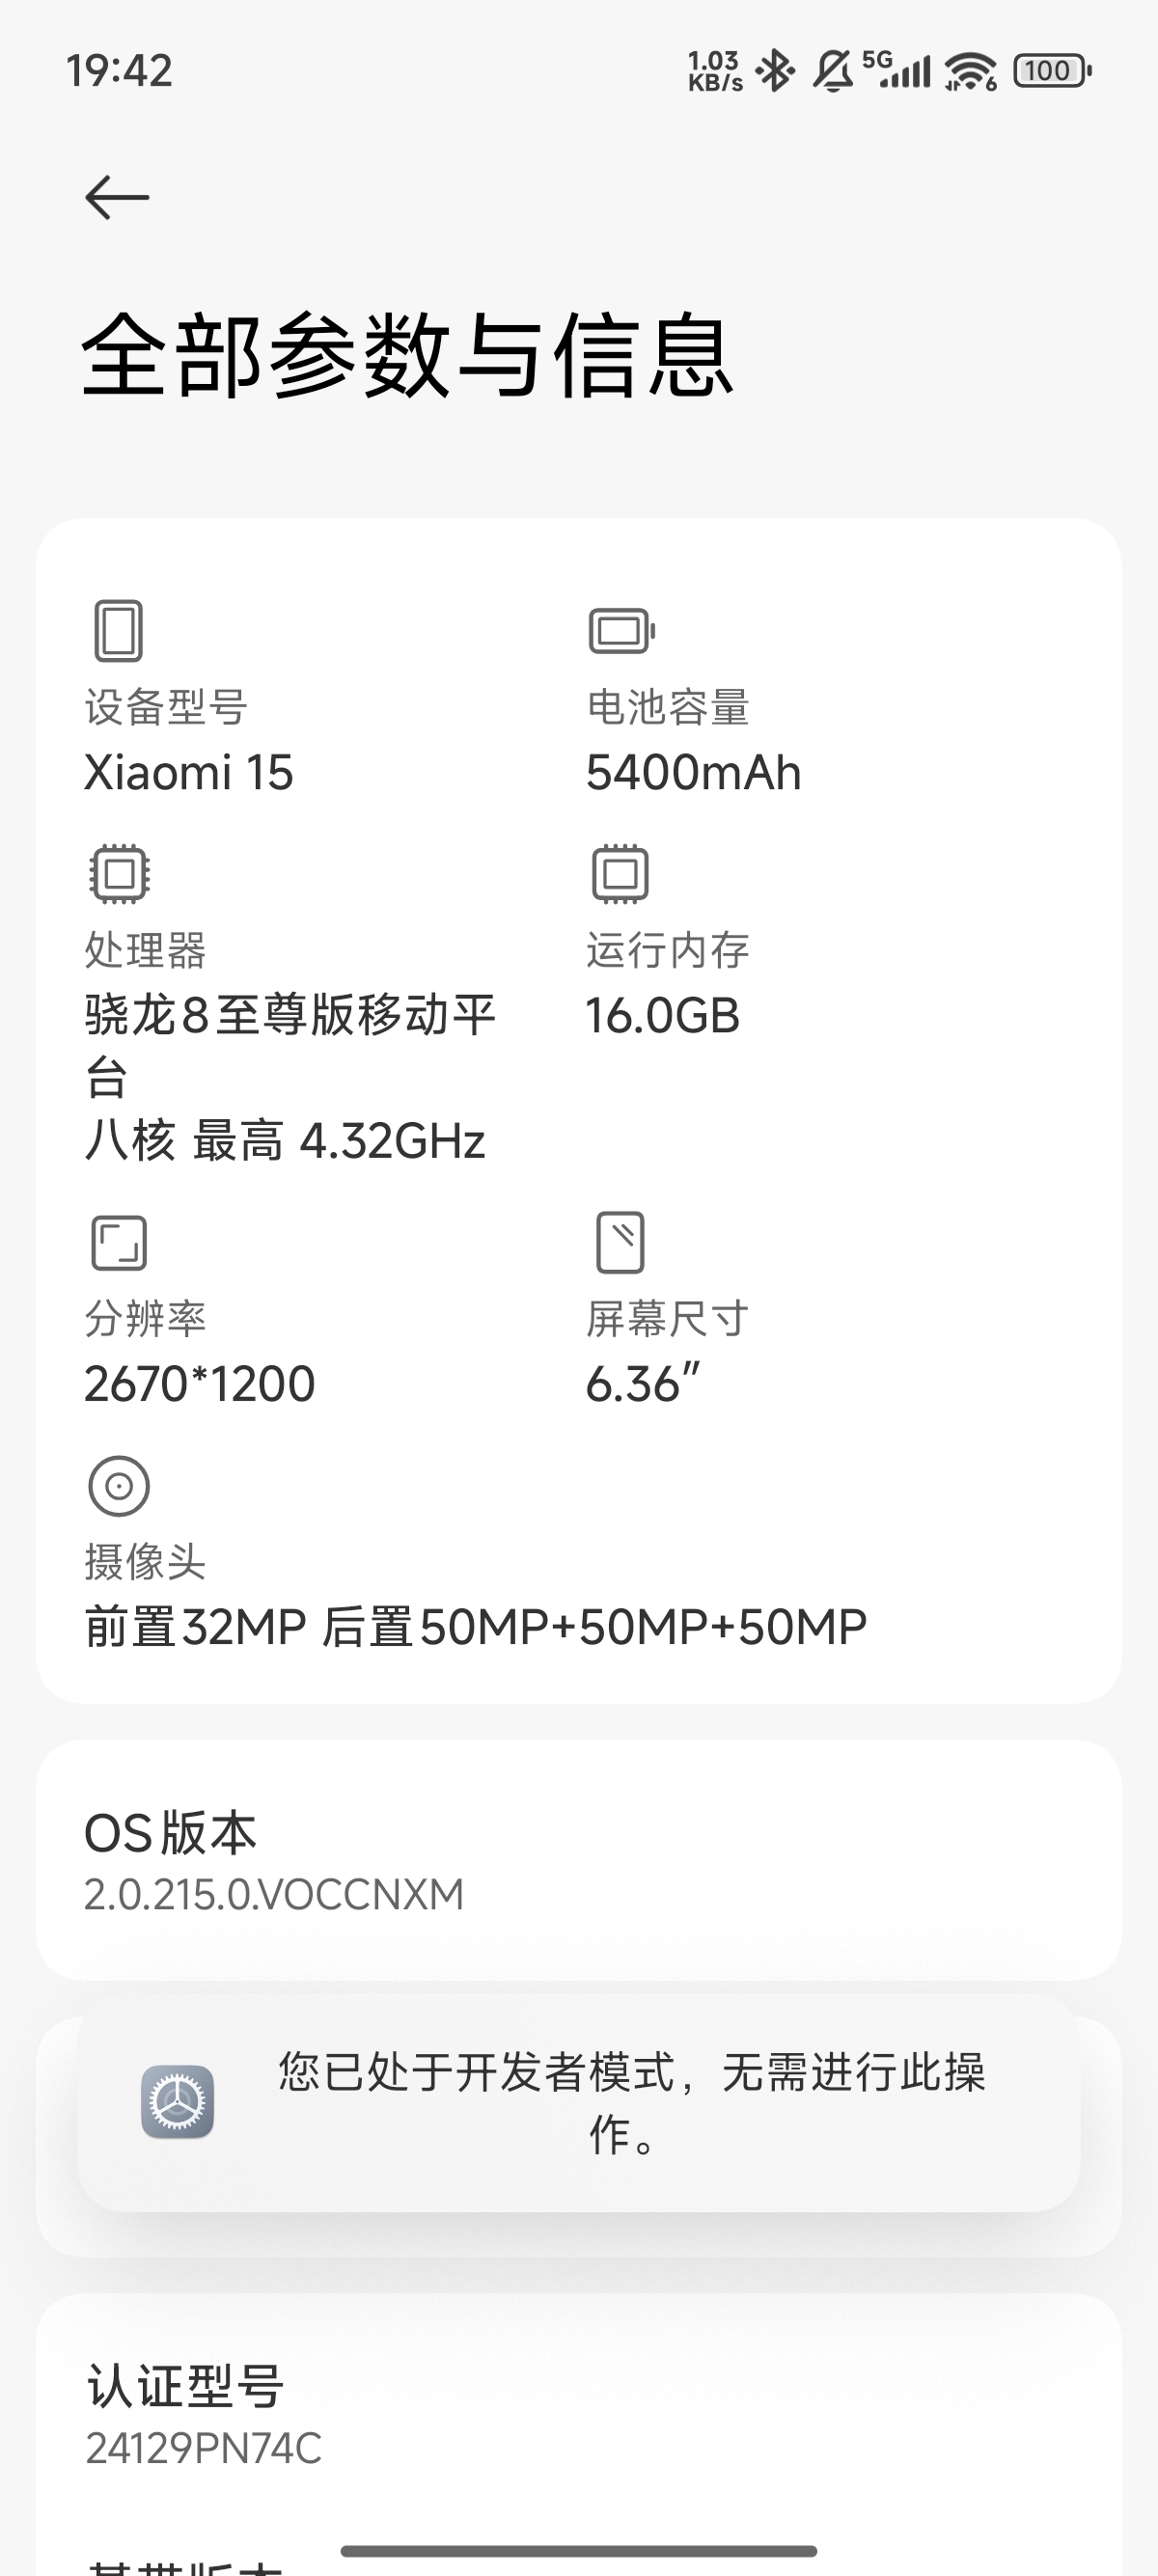
Tap the system version number five times (on my phone, it’s labeled “OS version”) until a message pops up saying “You are now in developer mode” or something similar:
Enable USB debugging on your phone:
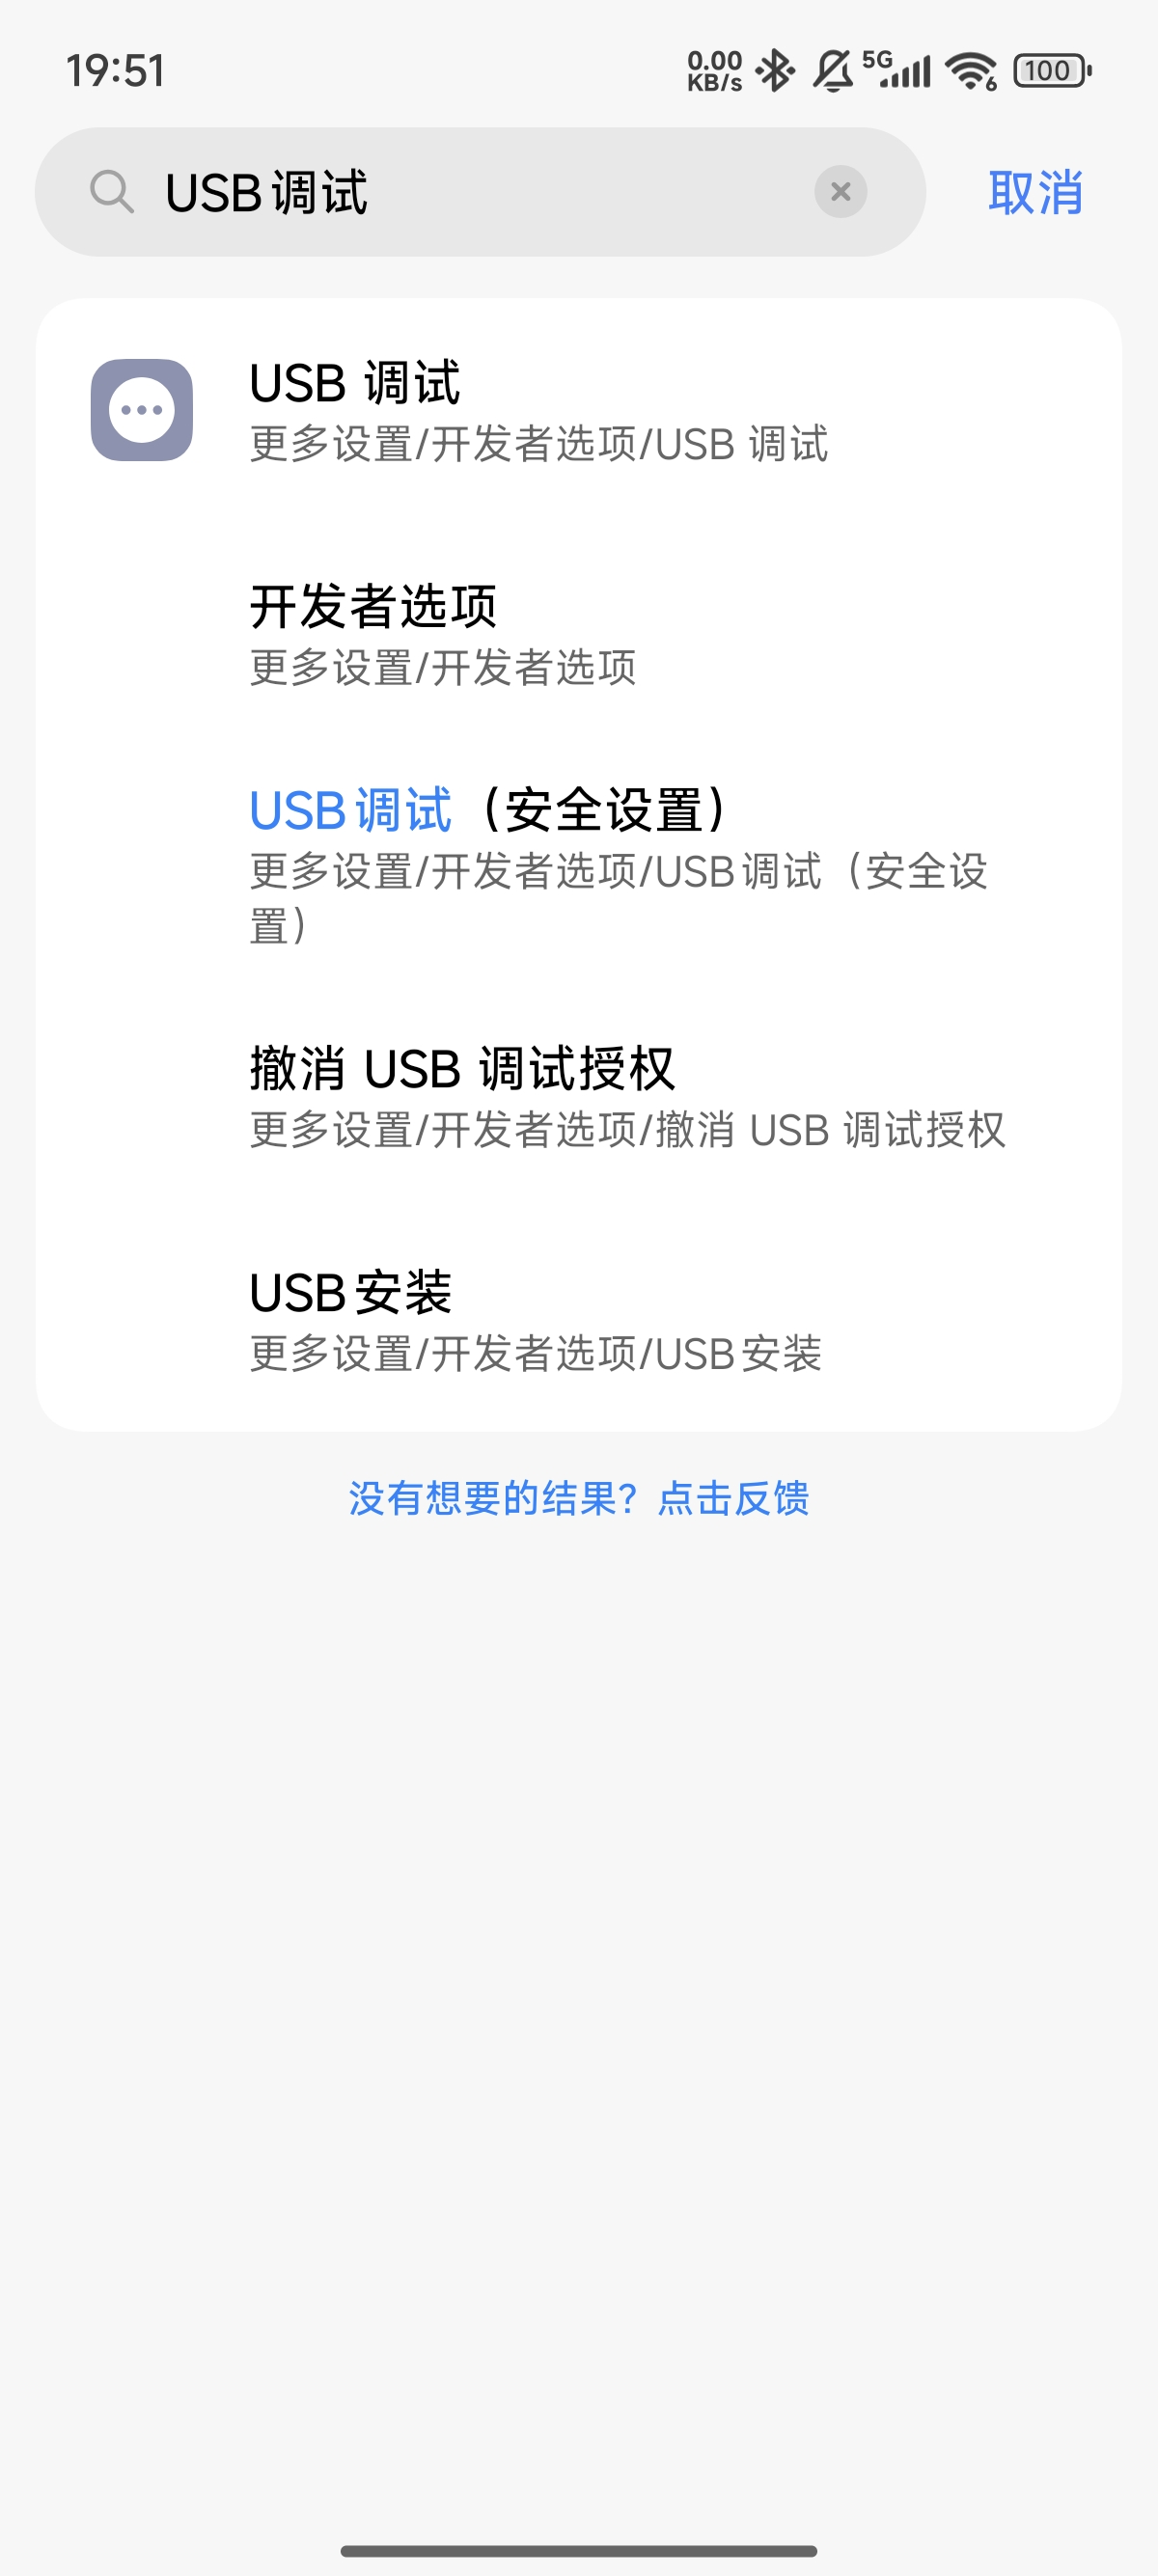
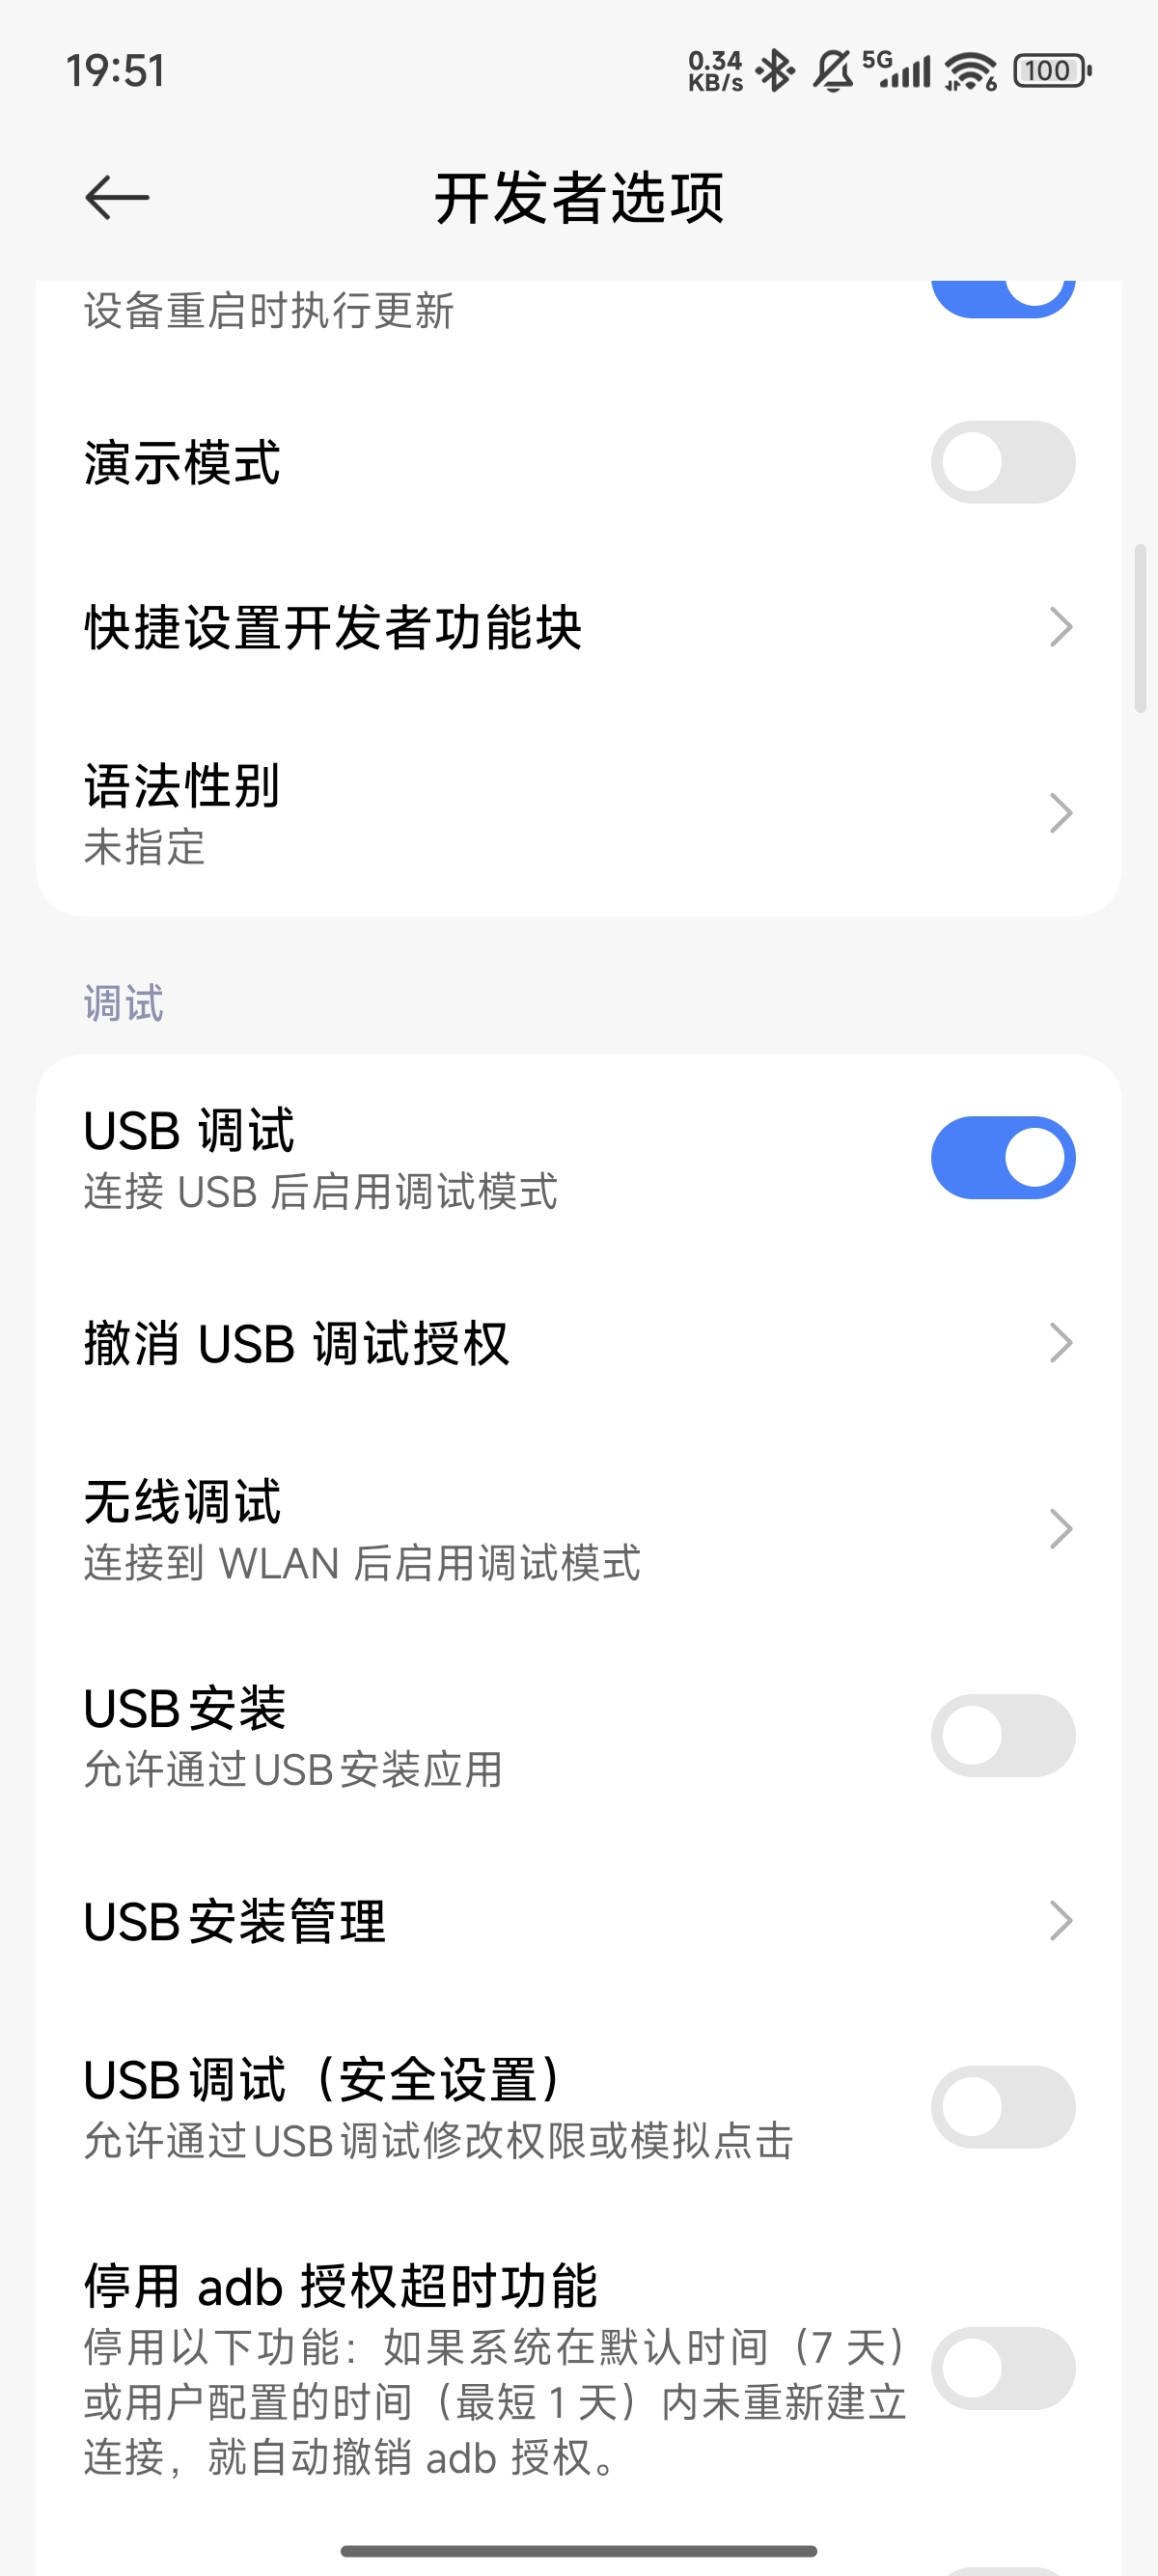
USB debugging is a sensitive permission, and some newer phones may show a warning pop-up. If you trust the device you are debugging with, you can agree to all permissions and disable USB debugging after the debugging session is complete.
At this point, the preparations on the mobile device are complete.
PC Side
Download and install Android Studio: directly from the official website Download Android Studio and App Tools - Android Developers
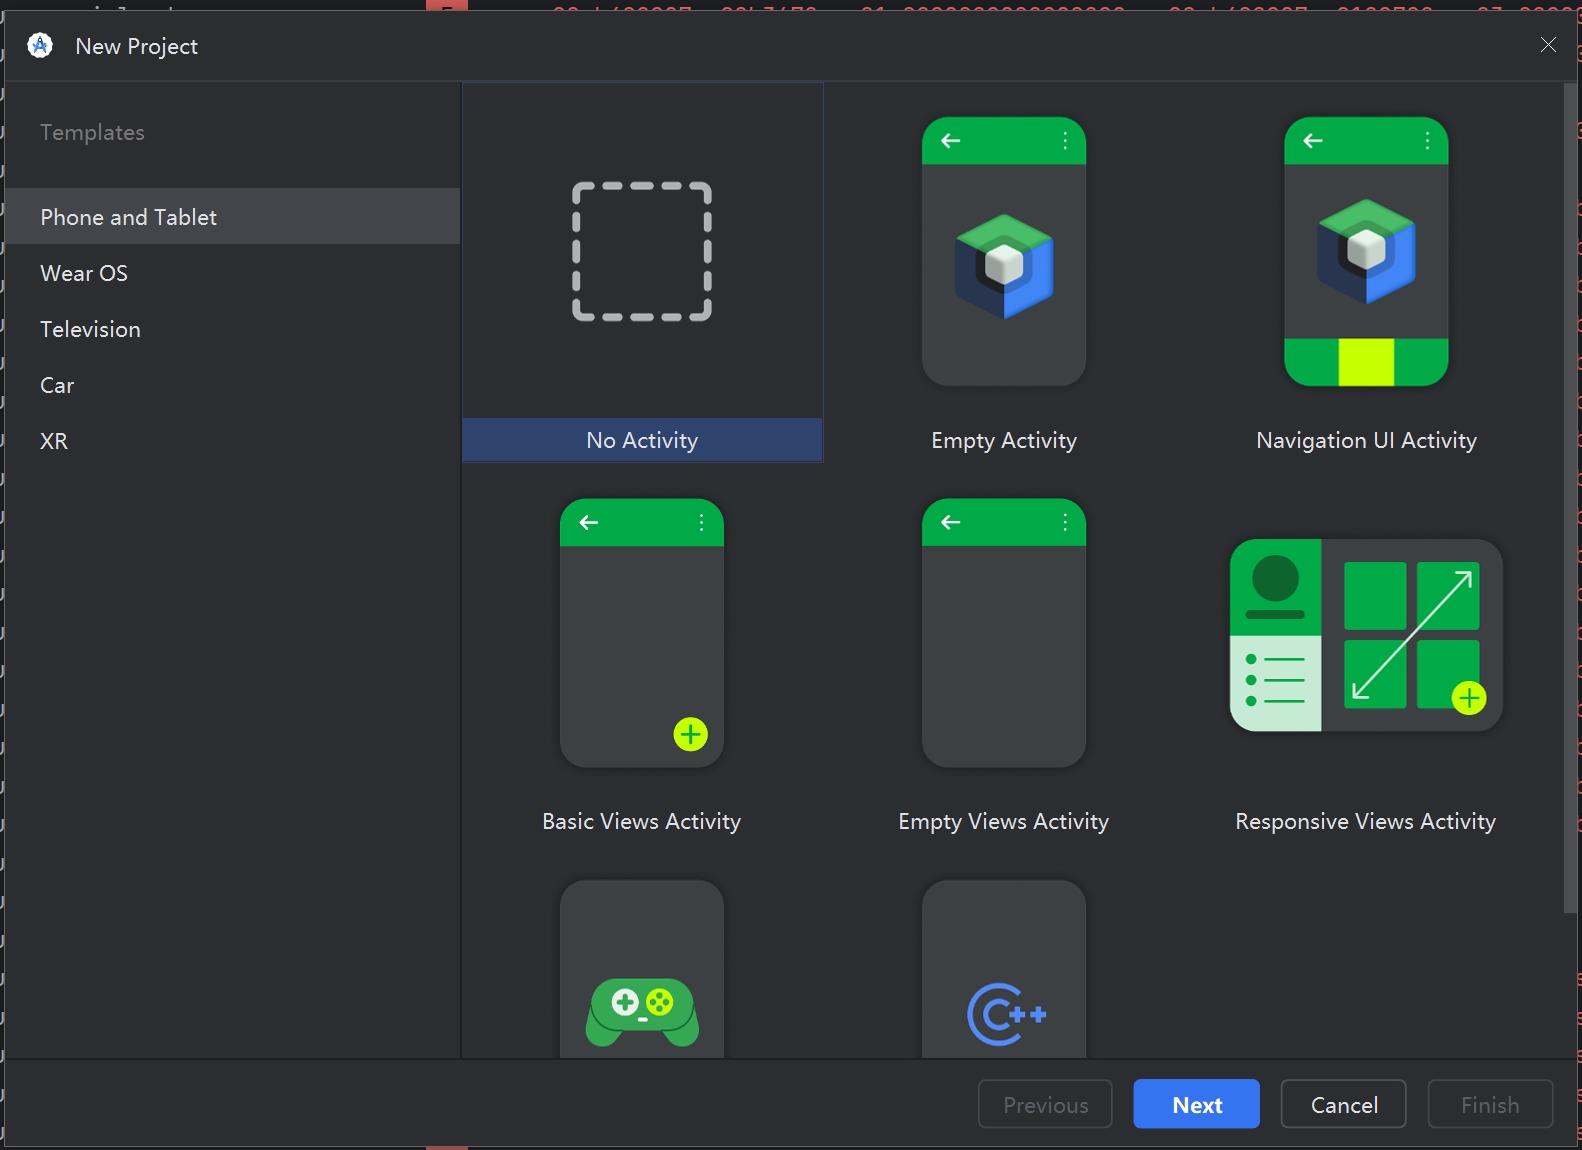
When you first start AS, it should prompt you to create a project, as shown below. Our goal this time is just to capture logs, so we don’t need to run any projects in AS, so select the first option “Empty Project.” Theoretically, selecting any other option won’t have much impact; we just need to enter the main interface of AS.
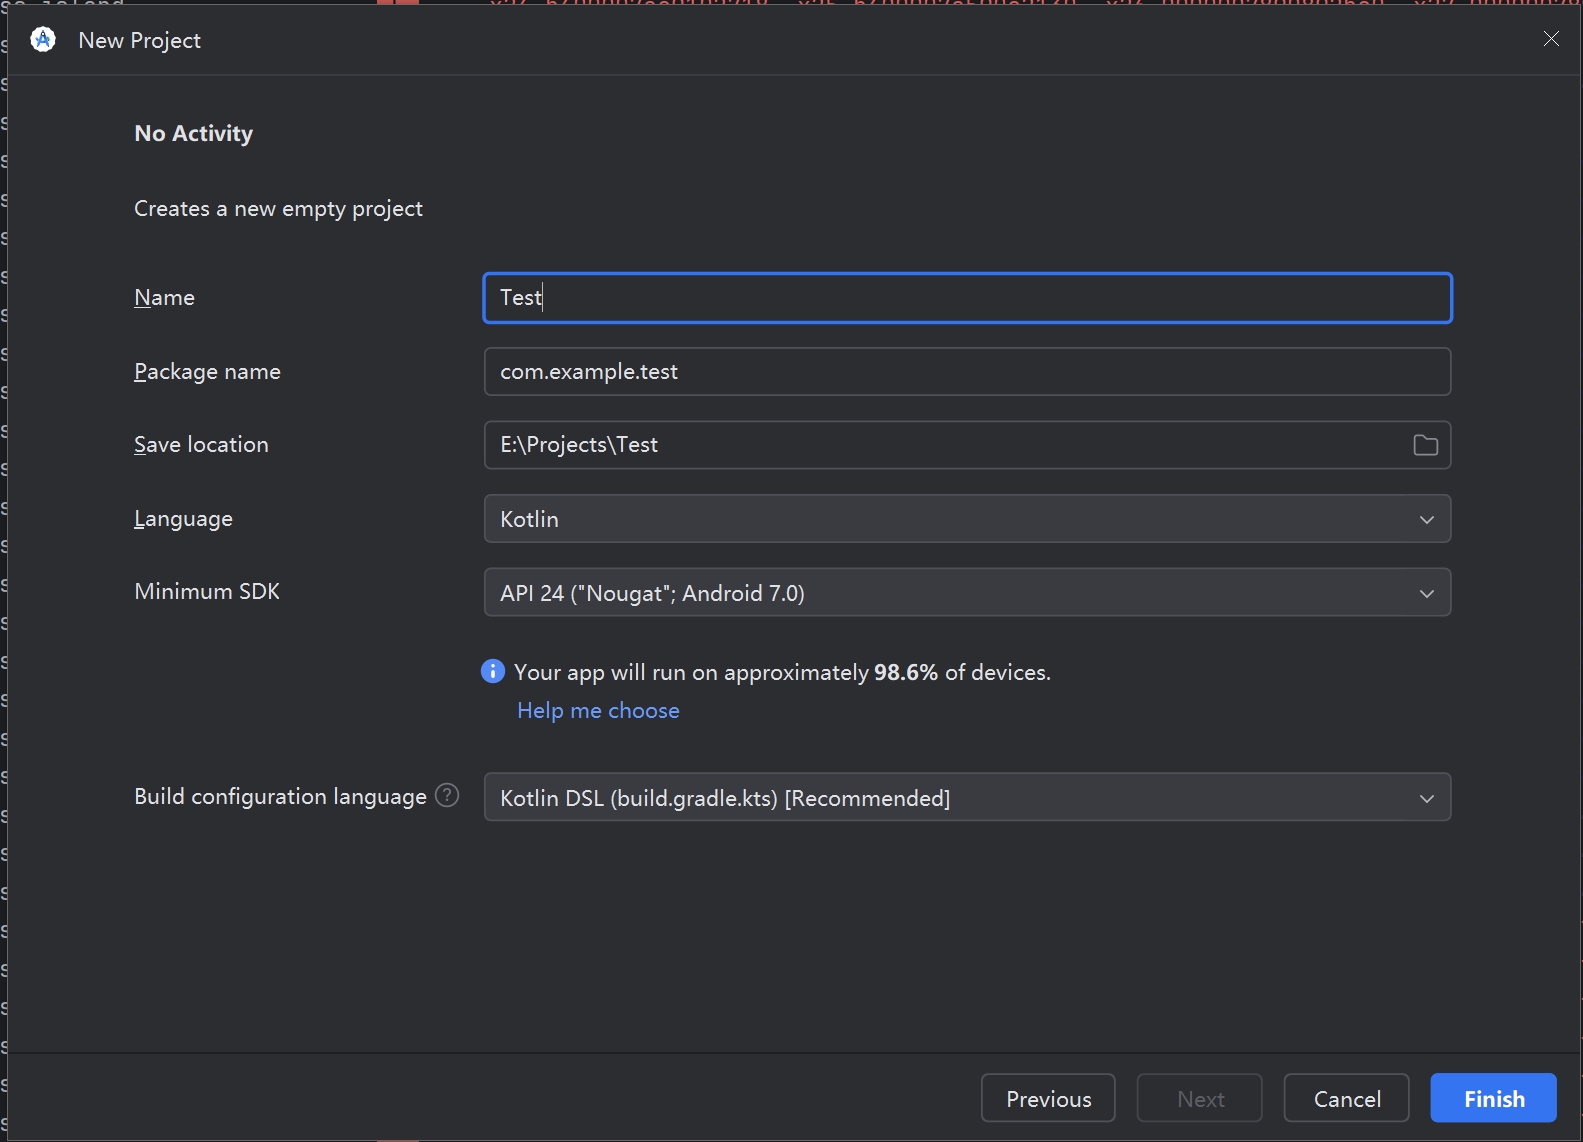
You can fill in any project name; we just need an empty project for testing.
The main interface of AS is shown below:
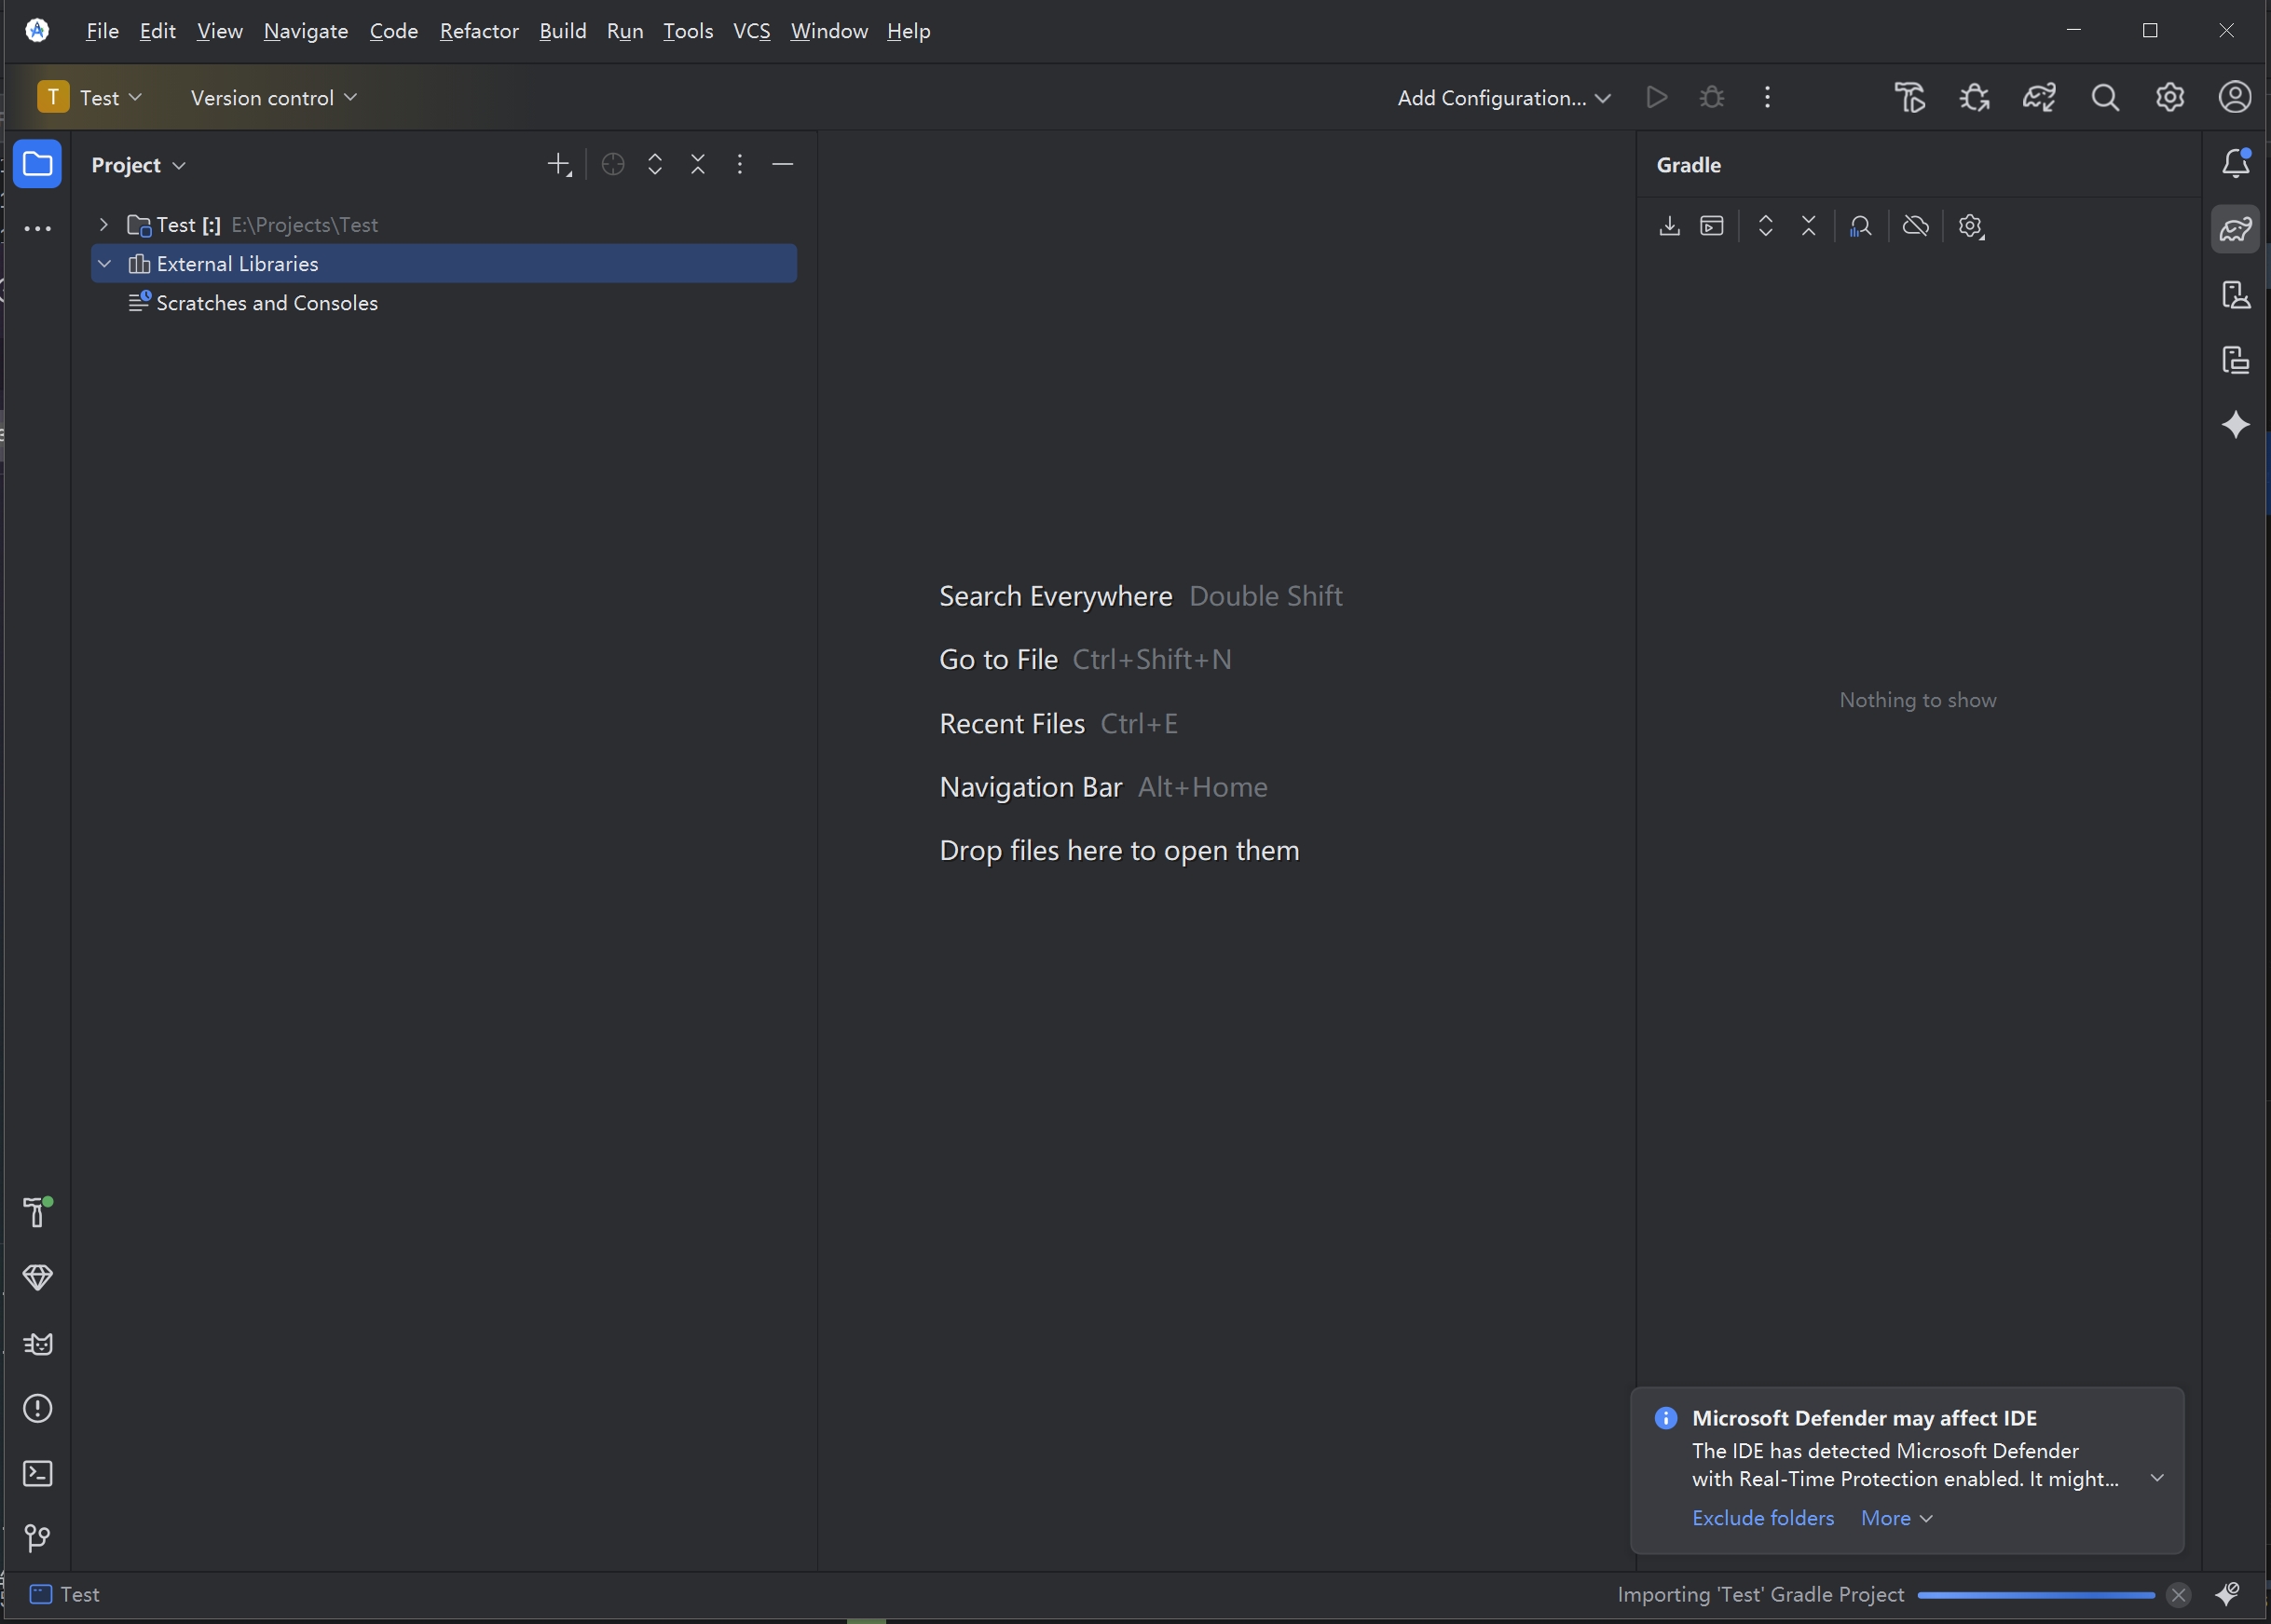
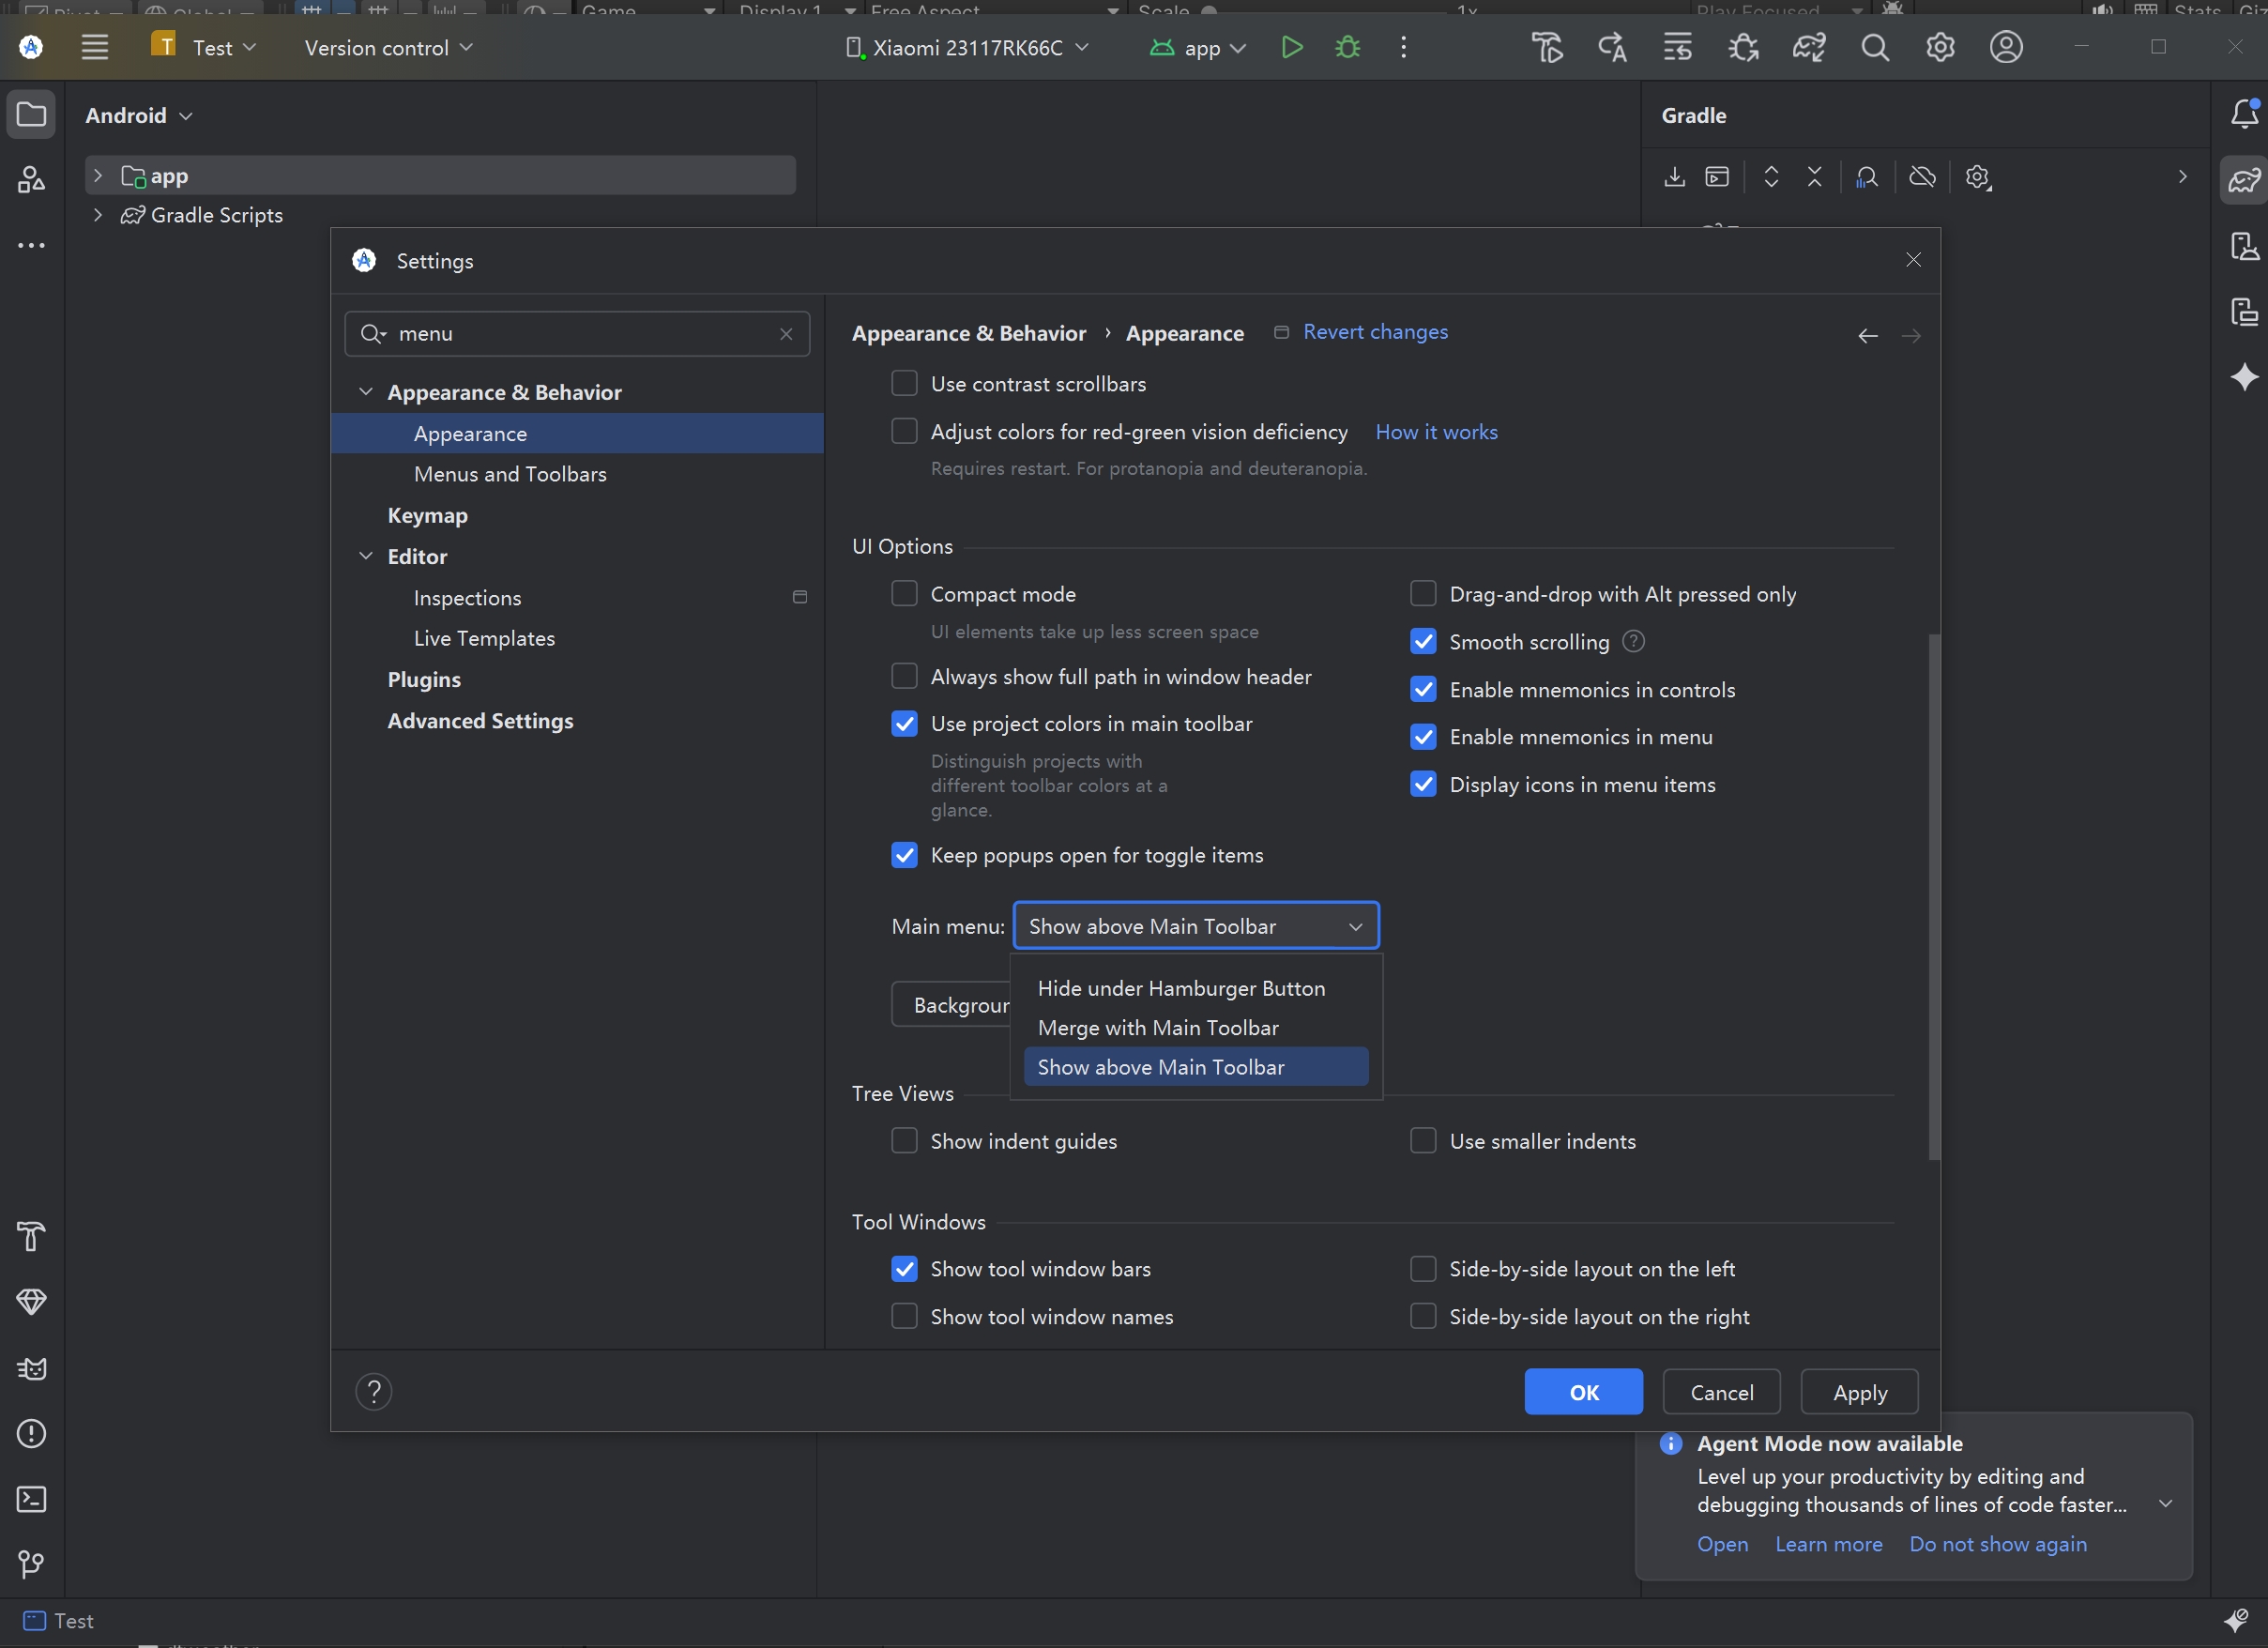
The new version of AS has inexplicably hidden the top menu bar by default. If you can’t see the top menu bar, press Ctrl+Alt+S to bring up the settings interface, then search for “menu” and set the “Main Menu” option as shown below to “Show above Main ToolBar.”
Next, install the plugin for USB debugging. Press Ctrl+Alt+S to open the settings interface, search for “Android SDK,” and select the “SDK Tools” option on the right:
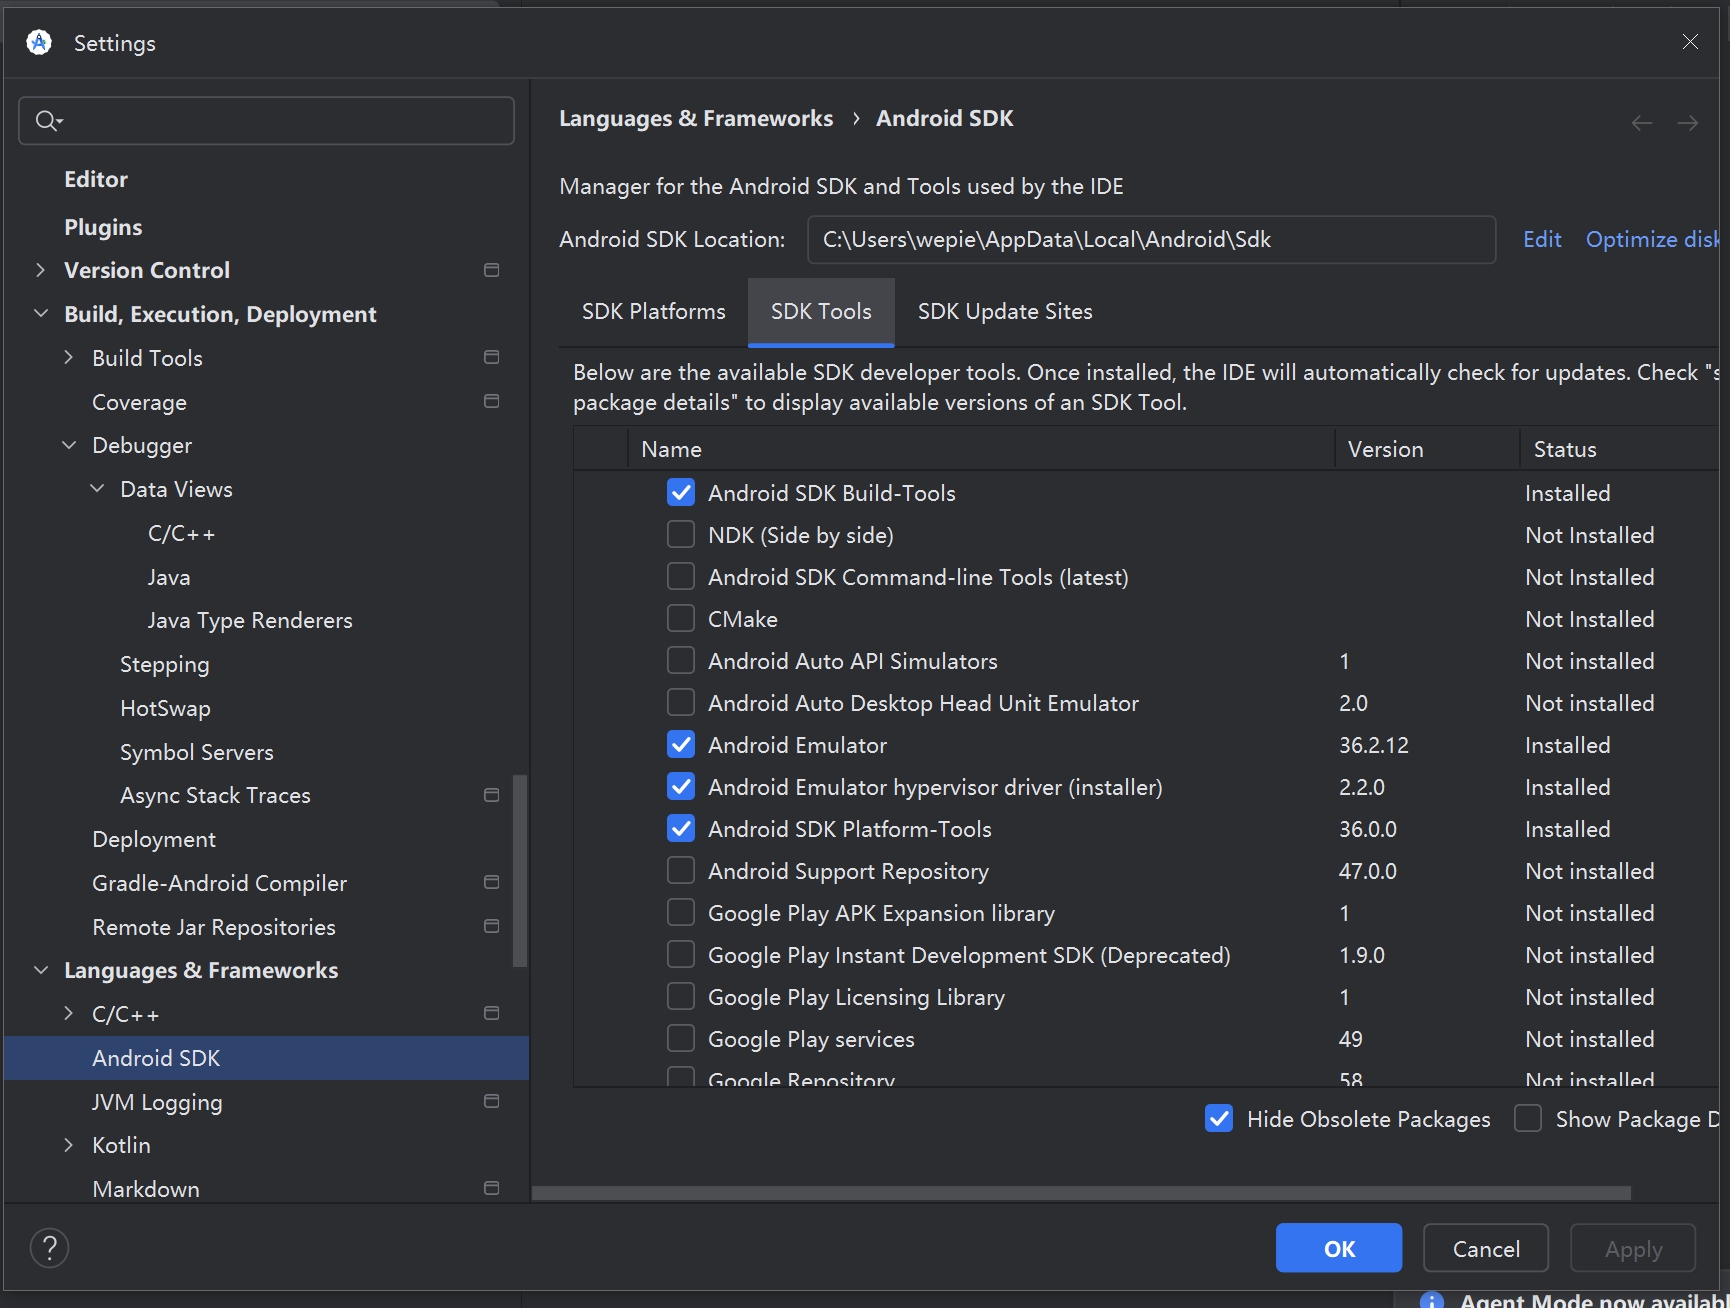
Different versions of Android Studio seem to have variations here; in some older versions, the “Android SDK” option is located under the “Appearance & Behavior/System Settings” category, which differs from the illustrated example. It’s still easier and quicker to search directly.
Select the “Google USB Driver” option from the list and click the “Apply” button in the lower
Log Capture
At this point, all the preparation work is complete. Connect the phone you just operated on to the computer using a data transfer-supported USB cable. If your phone prompts you when connecting to the computer, select options like “Allow data transfer” and “Trust this device.”
If your operations are correct, the top of the AS screen should display similar information:

You should now see the name of your device.
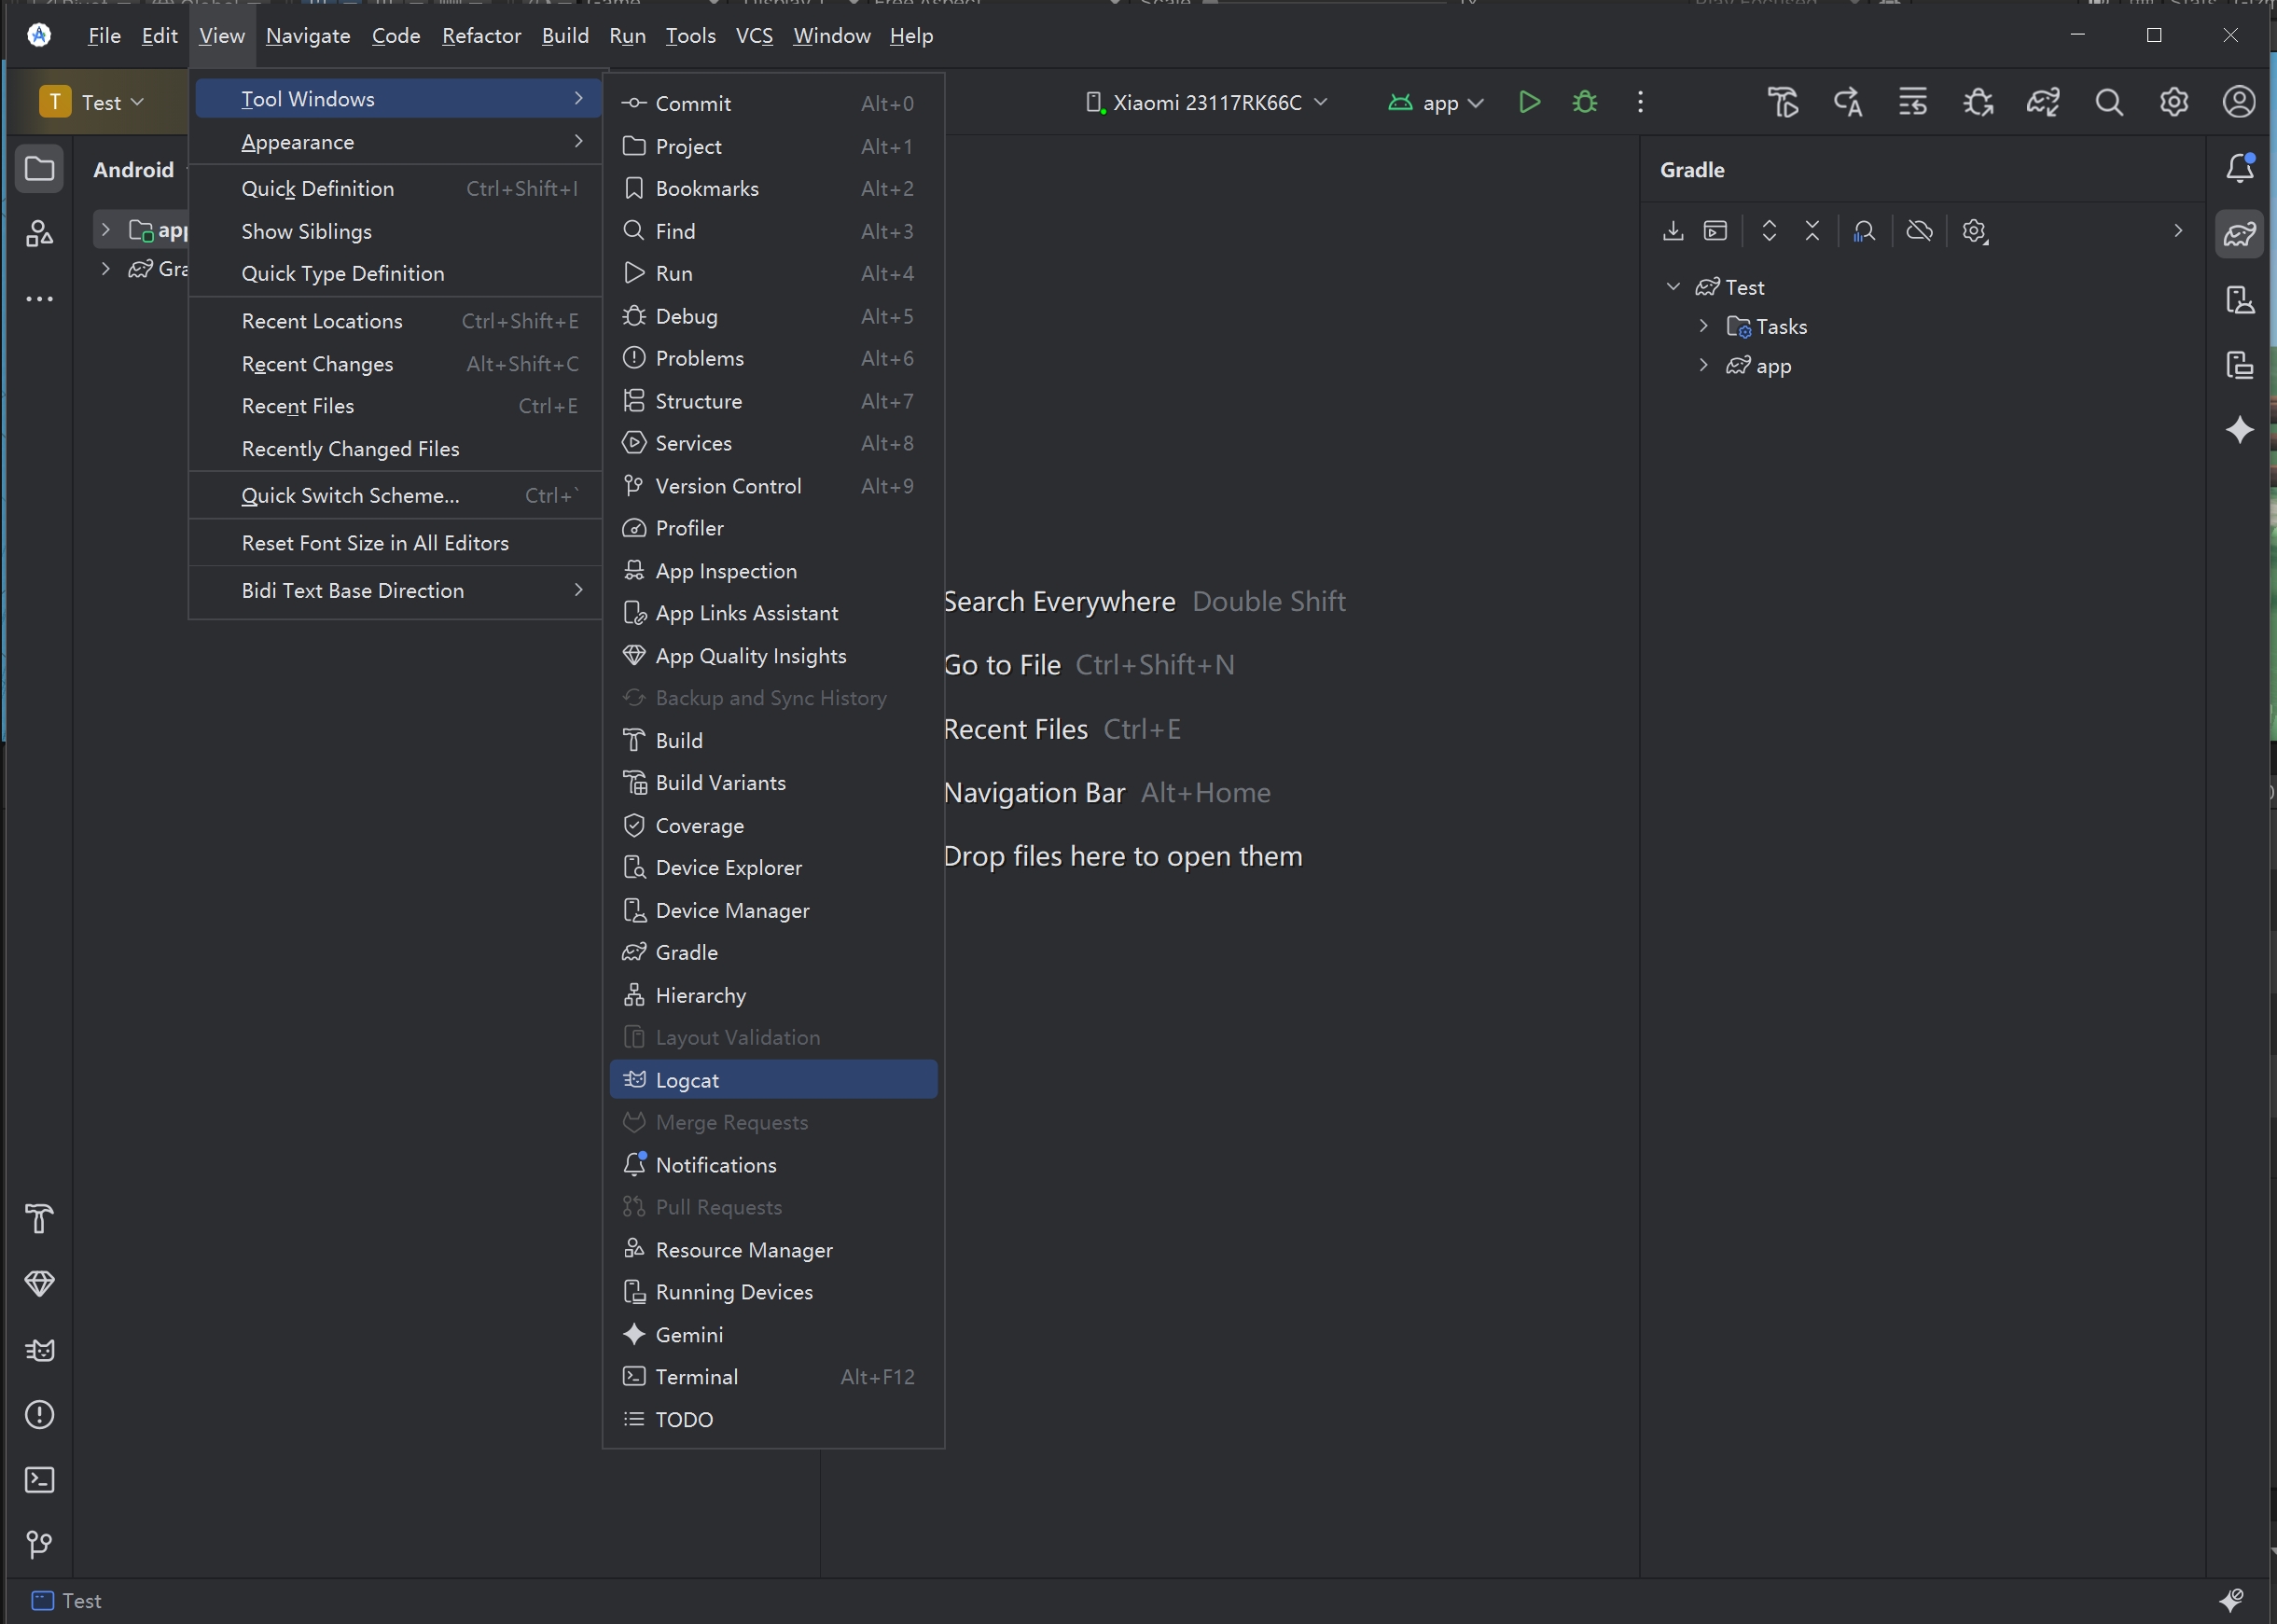
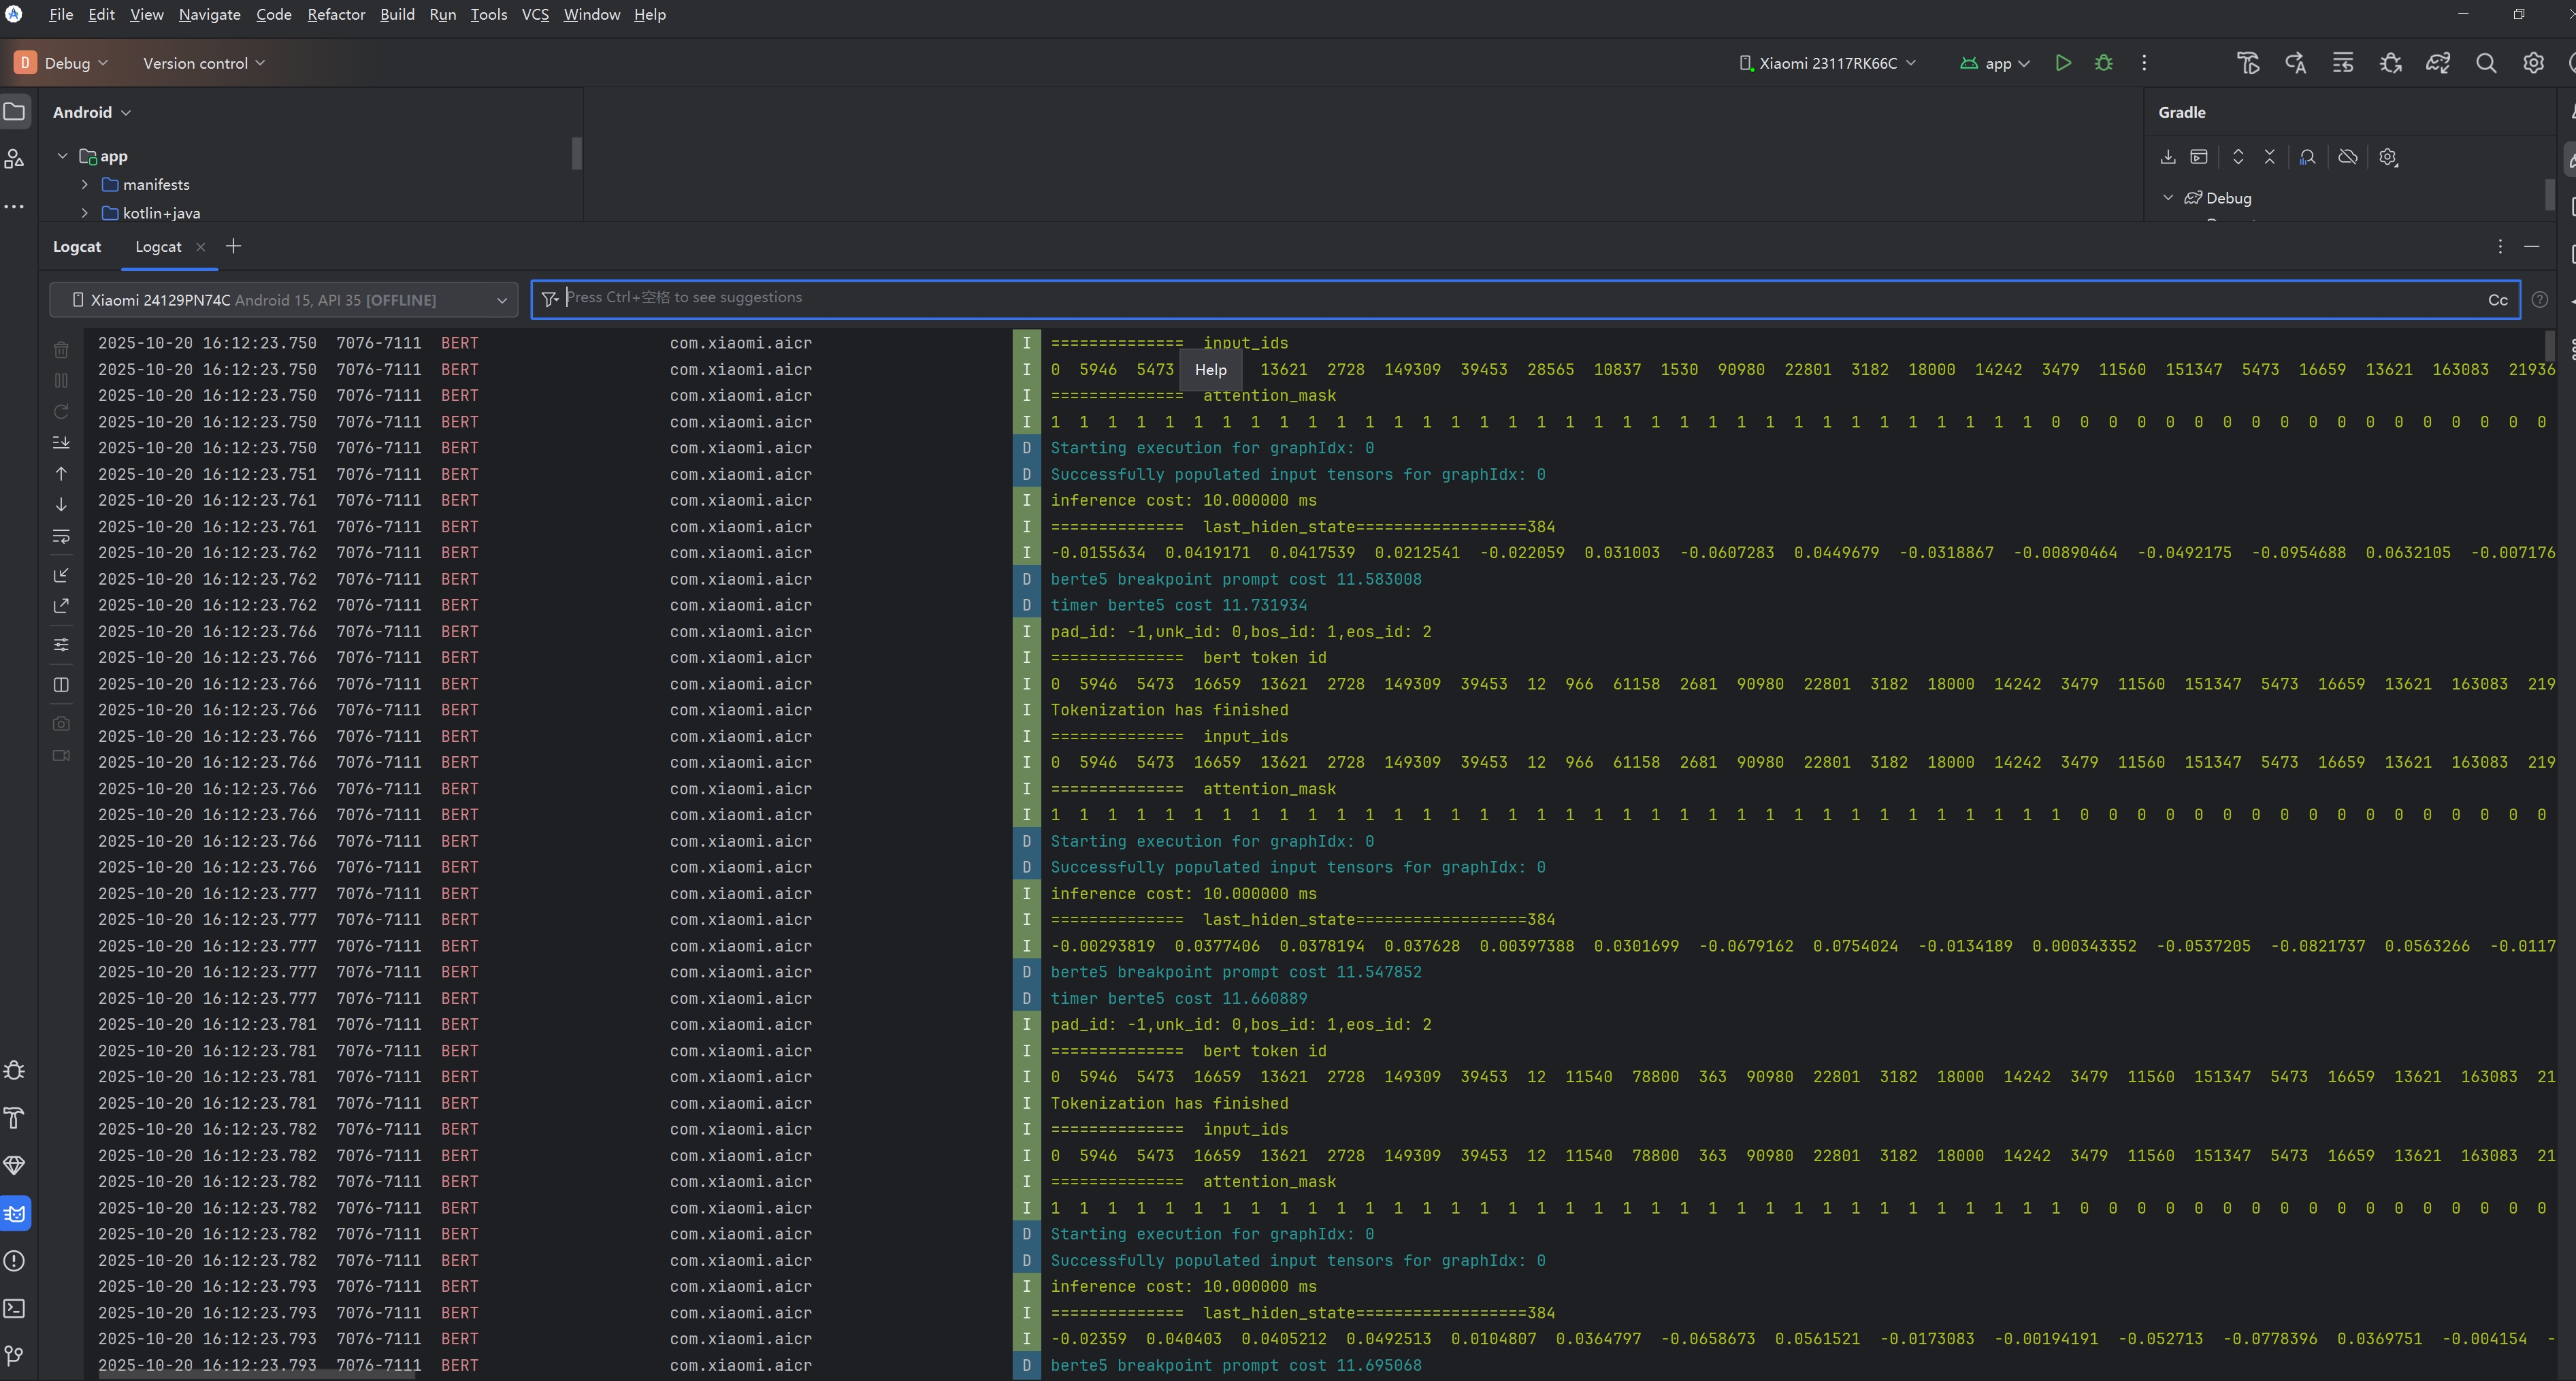
In the menu bar, select Logcat under View - Tool Windows. This is the built-in log processing tool in the new version of AS:
The Logcat window should look something like this: If your device is connected, various logs may pop up rapidly. You can filter them using the filter box above. Typically, for debugging a specific application, you can directly use the application’s package name, such as com.tencent.wechat, etc.
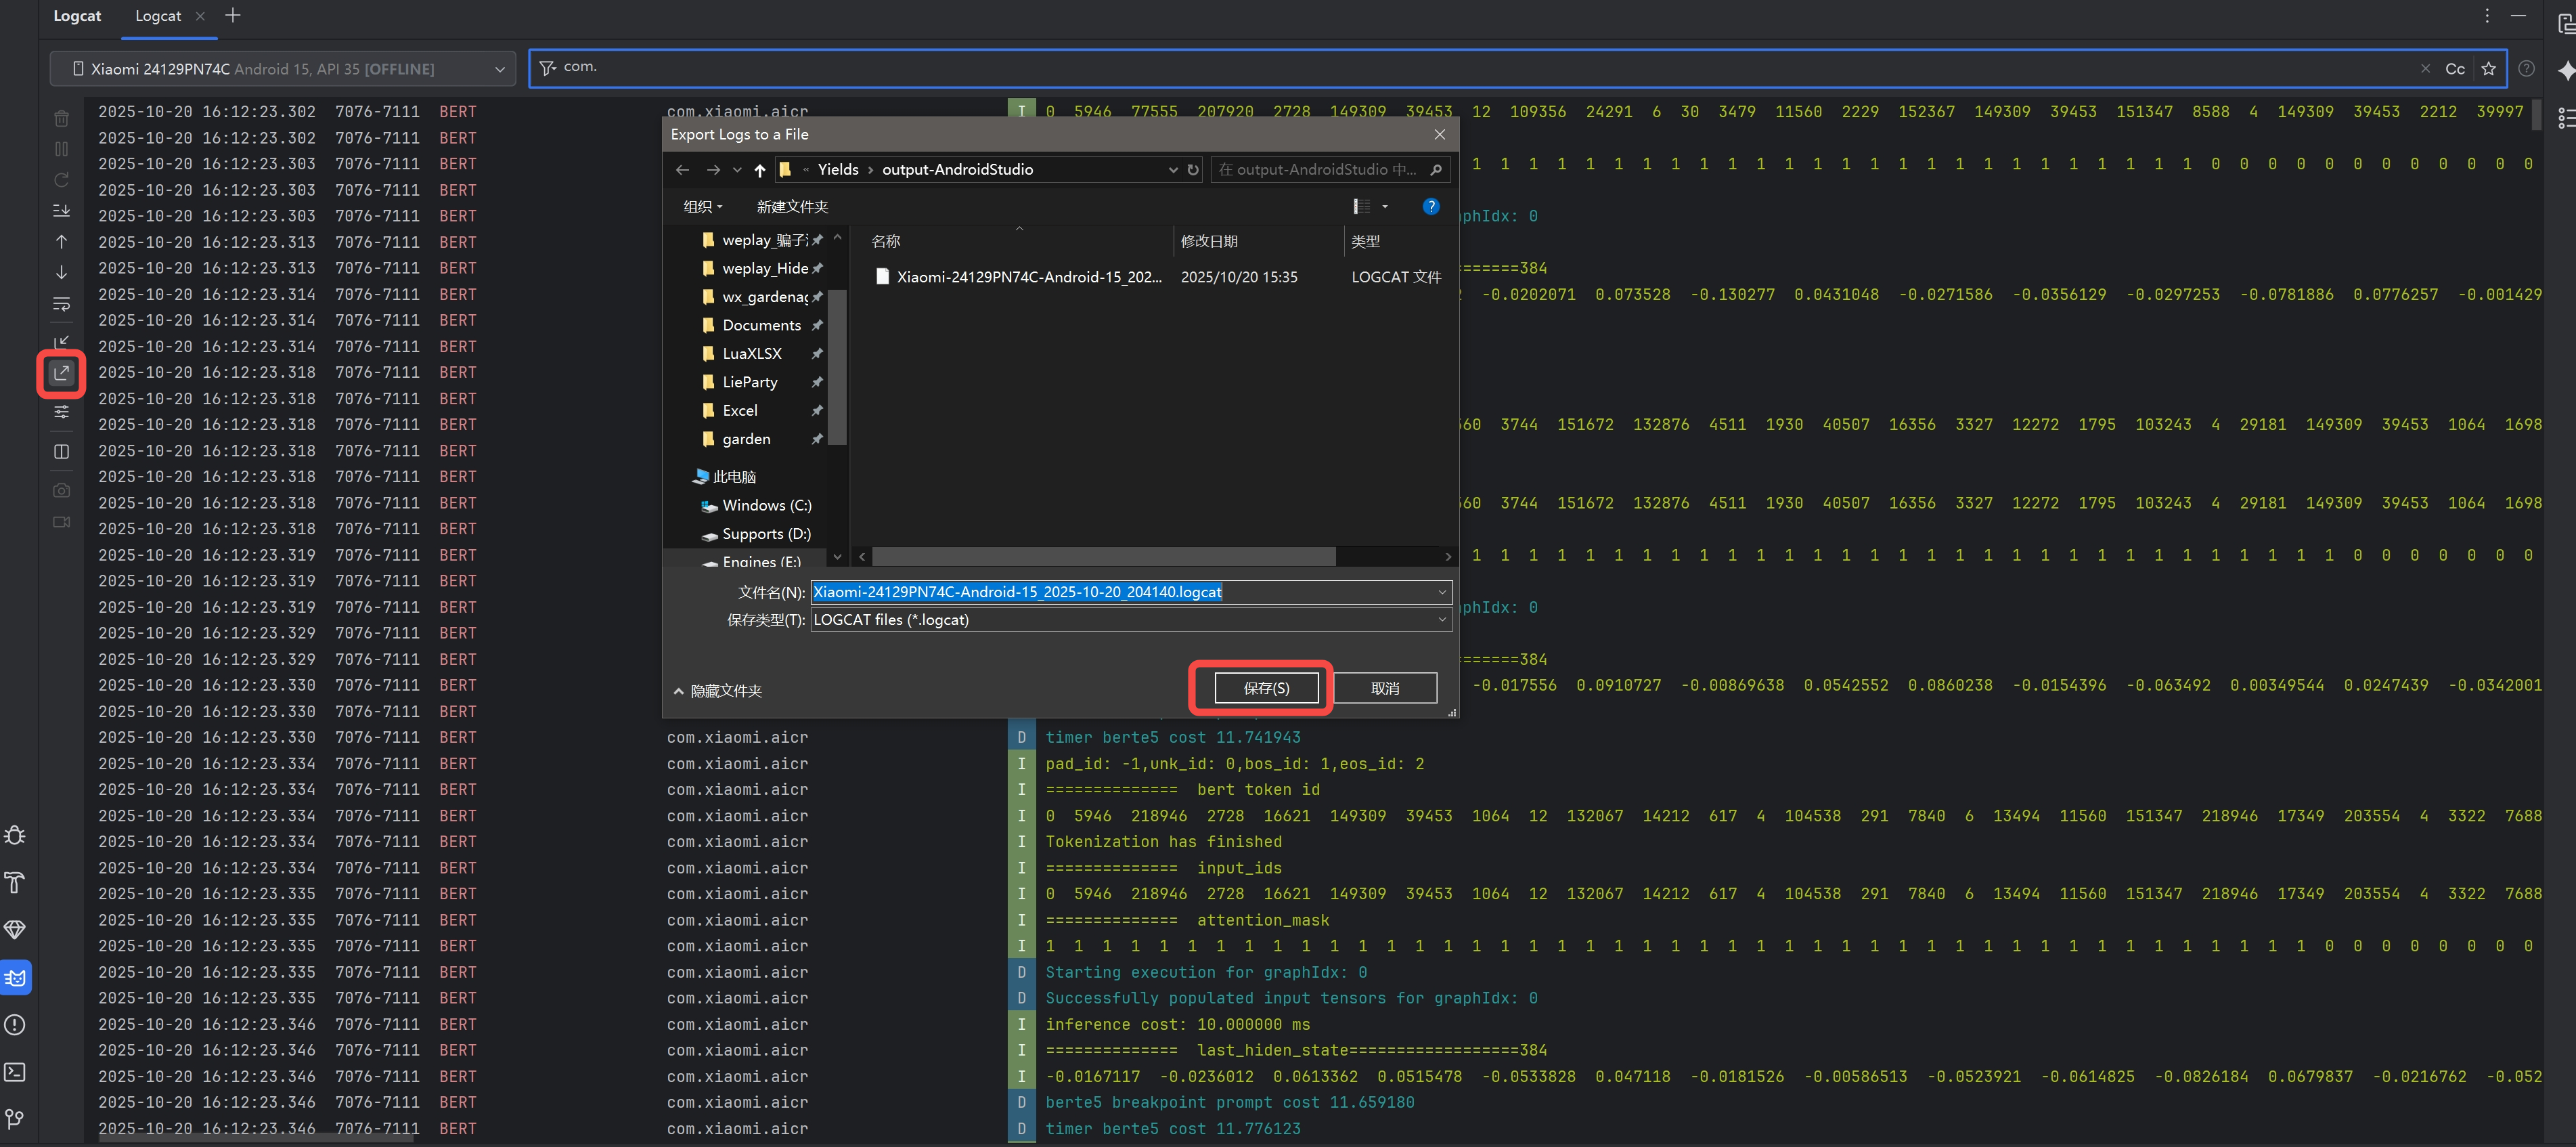
You can now run the problematic program. Generally, the logs will include the program’s own logs as well as related system logs, and events with a Crash level will be recorded. Once you locate the key information, you can click the button on the left side of the Logcat window to export the logs for easier analysis and review.